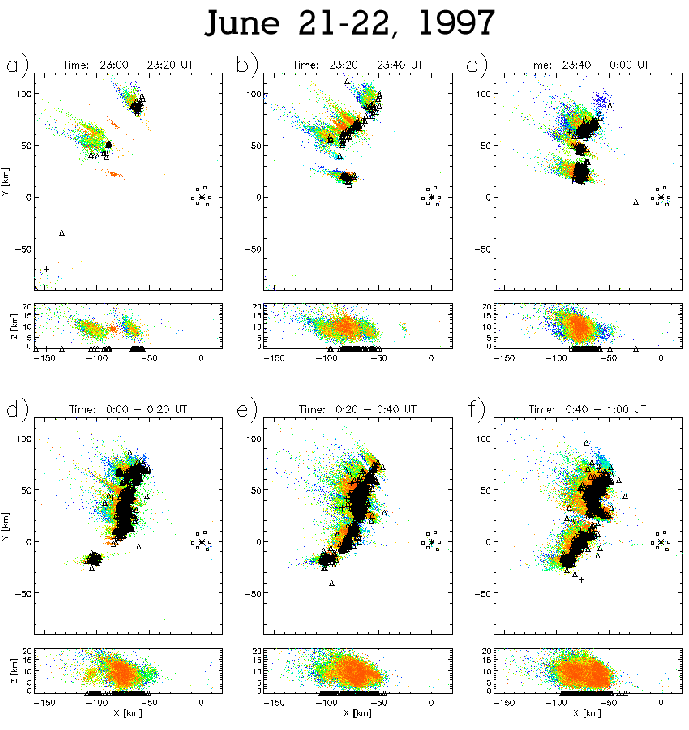
Figures 3.1-3.2 show the
formation, maturation, and dissipation of a mesoscale convective
system (MCS) over a time span of 4 hours between 23 UT on June 21, and
3 UT on June 22, 1997 (7-11 pm Eastern Daylight Time on June 21). The
data points are 3D lightning VHF source locations determined by LDAR.
These points are rainbow-colored with respect to time such that blue
corresponds to VHF sources near the beginning, yellow is near the
middle, and red is near the end of each 20 minute time interval. The
![]() and
and ![]() symbols correspond to -CG and +CG stroke
locations, respectively, as determined by the National Lightning
Detection Network (NLDN) (Cummins et al., 1998).
symbols correspond to -CG and +CG stroke
locations, respectively, as determined by the National Lightning
Detection Network (NLDN) (Cummins et al., 1998).
In Figure 3.1a, a couple of isolated thunderstorms
produced lightning throughout the 20 minute time interval. Towards
the end of the time interval, a couple of new storms each produced
their first intracloud discharge, as denoted by the clusters of red
data points between and to the south of the active storms. Note the
significant radial errors manifested by the spreading of the points
along a radial line to the LDAR stations (![]() symbols).
symbols).
In Figure 3.1b, additional storm cells became electrified and these storms began to organize into a line. In the next time interval, the cell on the northern edge became inactive while the CG flash rate from the other cells intensified. In Figure 3.1d, new electrically active cells were evident on the southern edge. The MCS flash rate appeared to have reached a maximum between 00-01:00 UT (Figure 3.1d-f).
 |
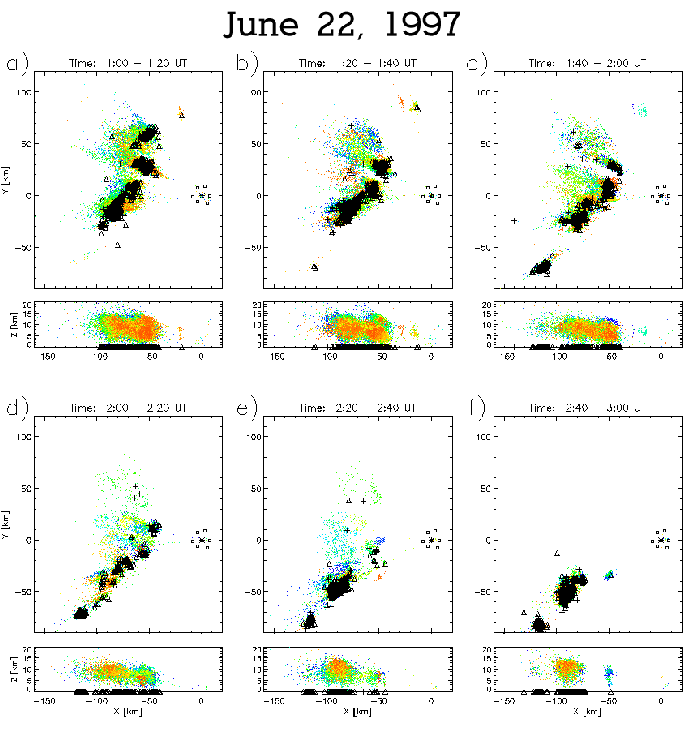 |
In Figure 3.2a, some discharges began to propagate into the region ``behind'' the northern half of the convective line. The horizontal discharges became more extensive with time, as evident in panel b). This pattern of increasing horizontal discharge dimensions was always readily evident 20 minutes or more prior to sprites, and turned out to be a good diagnostic for predicting where sprites might appear. In contrast, the CG strike locations indicated by NLDN did not provide any predictive lead time as to when and where sprites might occur. However, it should be noted that increasing horizontal discharge extent was not always followed by sprites, particularly if the discharges were somewhat 1-dimensional with a limited total area.
A large number of NLDN-indicated +CGs were associated with the active
cell on the southern end of the storm line in
Figures 3.2a-b. Almost all of these ``+CGs'' had
NLDN signal strengths below 100 LLP units (![]() kA peak current).
An earlier unpublished study (by the author) of weak ``+CG'' sferic
records indicated that such events were probably ICs, though this has
not yet been quantified. A few NLDN-indicated +CGs were evident in
the region of horizontally extensive discharges. All of these
``+CGs'' were also weak at under 150 LLP strength and may also have
been ICs. The northermost ``+CG'' is known to be a false detection
which followed less than 0.2 ms after a real -CG from the
northernmost active convective cell.
kA peak current).
An earlier unpublished study (by the author) of weak ``+CG'' sferic
records indicated that such events were probably ICs, though this has
not yet been quantified. A few NLDN-indicated +CGs were evident in
the region of horizontally extensive discharges. All of these
``+CGs'' were also weak at under 150 LLP strength and may also have
been ICs. The northermost ``+CG'' is known to be a false detection
which followed less than 0.2 ms after a real -CG from the
northernmost active convective cell.
Sprites were initiated by many of the +CGs associated with horizontally extensive discharges in Figure 3.2c. The sprite events were coincident on video with the +CGs at 01:42:57.172, 01:47:52.711, 01:51:02.762, and 01:55:47.956 UT. These sprite events and their parent discharges are examined in detail later in this chapter. Additional sprite events occurred at 02:09:16.9, 02:09:17.1, and 02:27:21.3 UT in Figures 3.2d-e. Unfortunately, the interferometer system failed to trigger for these events.
The storm system continued to advance southward as new cells formed at the southern edge. However, it is clear that the convective line lost its cohesion in Figure 3.2. The storm complex eventually subsided within a few hours and no sprites were observed after the 02:27 UT event.