At 5:38:00.77 UT on July 24, 1996, a bright sprite event was observed on video from both Langmuir Laboratory, New Mexico and Yucca Ridge, Colorado. A slow field change recorded at Langmuir was coincident with the sprite appearance in video. Red and blue photometery of the sprite event was recorded by Walt Lyons and Tom Nelson at Yucca Ridge. The position of the sprite was triangulated from the video observations. The light propagation delays to each site was subtracted from the corresponding waveforms and the result is shown in Figure 4.1.
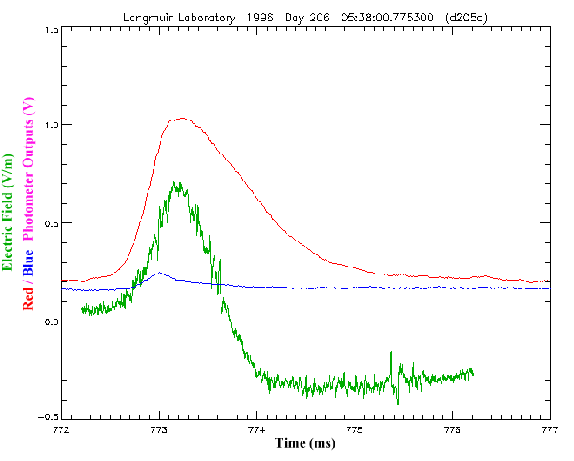 |
The distance between the sprite and Yucca Ridge was sufficiently great
(![]() km) that the parent discharge was well below the horizon and
thus could not significantly contaminate the photometer signal. The
strong correlation between the sprite's light output and the electric
field change provides clear evidence that the sprite, not the parent
discharge, was the source of the field change.
km) that the parent discharge was well below the horizon and
thus could not significantly contaminate the photometer signal. The
strong correlation between the sprite's light output and the electric
field change provides clear evidence that the sprite, not the parent
discharge, was the source of the field change.
The peak in the blue photometer signal leads that in the red. This may be due to millisecond-scale timing errors which affected the blue channel (T. Nelson, personal communication, 1997). However, other measurements (Armstrong et al., 1998; Suszcynsky et al., 1998) have shown that blue emissions lead those of the dominant lower energy red emissions, indicating that significant ionization occurs during sprite generation. The identity and nature of the ionization mechanism is disclosed in Chapter 5.
Cummer et al. (1998) independently confirmed the correlation of the
photometer signal with the sprite field change for 3 sprite events.
Using an ELF propagation model and a vertical sprite extent of
![]() 30 km, they estimated that the sprites had peak currents
(integrated across their horizontal extent) of 1.6-3.3 kA and total
charge transfers of 5-42 C. Reising et al. (1999) observed that the
sprite charge moment change was linearly related to the total sprite
luminosity. They also noted that
30 km, they estimated that the sprites had peak currents
(integrated across their horizontal extent) of 1.6-3.3 kA and total
charge transfers of 5-42 C. Reising et al. (1999) observed that the
sprite charge moment change was linearly related to the total sprite
luminosity. They also noted that ![]() 20% of sprite events are
accompanied by an ELF pulse. The author's observations also support
this estimate.
20% of sprite events are
accompanied by an ELF pulse. The author's observations also support
this estimate.