An actual atmospheric profile can vary somewhat from the 1976 U.S. Standard Atmosphere. The amount of variation will depend on the latitude, day of the year, and even the time of day. Figure 2.4a corresponds to Figure 2.10 in U.S. Standard Atmosphere Supplements, 1966, which utilizes the 1962 U.S. Standard Atmosphere as the reference. The difference between the 1962 and 1976 models are small within the mesosphere, so the comparison also applies to the 1976 U.S. Standard Atmosphere.
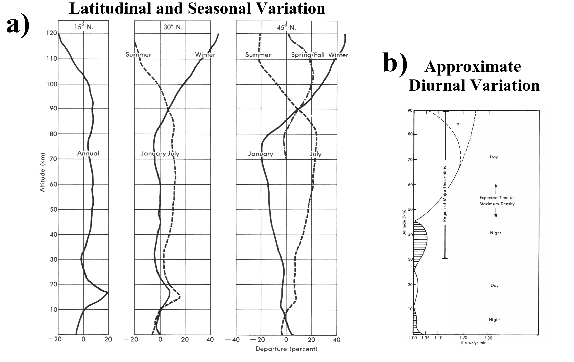 |
Figure 2.4a shows how the air-density varies for 3 different latitudes as well as different times of the year. Generally, the higher the latitude, the more seasonal variation there will be.
Sprites within the U.S. are most numerous in July and August
(Lyons et al., 1999), which is near the time when the air density
within the mesosphere is at a maximum (Figure 2.4a). This
would imply that at any given altitude, the breakdown field, ![]() ,
also increases during the summer. For instance, during the summer
season
,
also increases during the summer. For instance, during the summer
season ![]() would be
would be ![]() 20% greater than in the spring and fall
seasons and
20% greater than in the spring and fall
seasons and ![]() 40% greater than in winter at 80 km altitude and
45
40% greater than in winter at 80 km altitude and
45![]() N latitude. However, the detailed comparisons of experiment
with theory in this dissertation will focus primarily on sprites which
occurred in the fall (see Section 5.3). The variation
from the standard atmosphere for the fall season will be small,
particularly in comparison to other sources of error.
N latitude. However, the detailed comparisons of experiment
with theory in this dissertation will focus primarily on sprites which
occurred in the fall (see Section 5.3). The variation
from the standard atmosphere for the fall season will be small,
particularly in comparison to other sources of error.
The approximate diurnal variation of air density within the mesosphere
is shown in Figure 2.4b. The nighttime air density near
80 km altitude can be as much as 25% less than the daytime density.
However, nighttime rocket soundings conducted from White Sands, NM,
(U.S. Standard Atmosphere Supplements, 1966, p. 31) measured
air-densities at 60-80 km altitude to be between ![]() 3% to
3% to ![]() 8% of
the standard atmosphere air densities. Thus, the 1976 U.S. Standard
Atmosphere model should be adequate for theoretical calculations
(Section 2.5) which will be compared with experimental
observations from Langmuir Laboratory, NM.
8% of
the standard atmosphere air densities. Thus, the 1976 U.S. Standard
Atmosphere model should be adequate for theoretical calculations
(Section 2.5) which will be compared with experimental
observations from Langmuir Laboratory, NM.