The relaxation time, ![]() , is the amount of time it would take for
an electric field to decay by
, is the amount of time it would take for
an electric field to decay by ![]() in the absence of additional
forcing. The relaxation time is related to the conductivity,
in the absence of additional
forcing. The relaxation time is related to the conductivity,
![]() , by the well known result:
, by the well known result:
![]() ,
where
,
where ![]() is the permittivity of free space.
is the permittivity of free space.
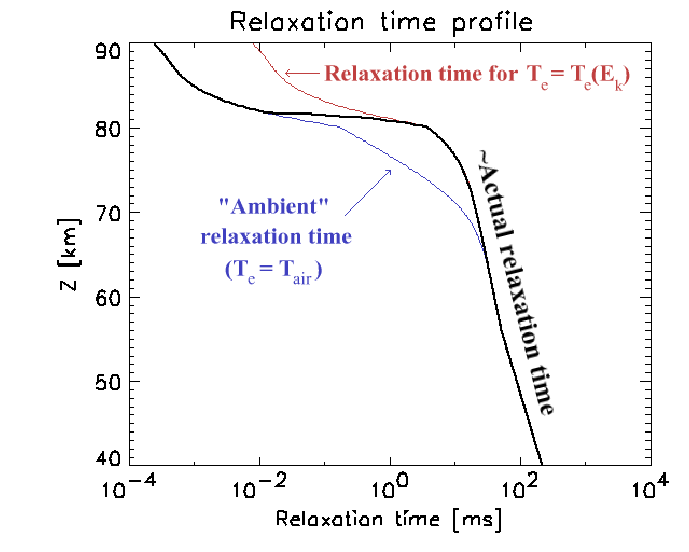 |
The total conductivity profiles in Figure 2.5 were used
to determine the corresponding relaxation times in
Figure 2.6. Note that the effect of the change in the
electron conductivity component due to electron heating just below the
base of the conductitivy ledge increases the sharpness of the
ionosphere conductivity ``ledge''. The relaxation time rapidly drops
to less than 1 ms above ![]() km altitude. This height will be
used in Section 2.5 as the base of the ionosphere.
km altitude. This height will be
used in Section 2.5 as the base of the ionosphere.