A 78.7 kA +CG occurred at 02:15:19.4192 UT. No sprites were seen in association with this +CG, though the image was saturated in the first field and was nearly saturated in the second by the bright parent discharge. Since sprites typically persist for at least 2 video fields, the lack of any structure in subsequent images suggested that no sprites were associated with this +CG, though this is not certain. The video clearly indicated that the subsequent +CG(s) of the same flash at 2:15:19.51 UT did not produce any sprites.
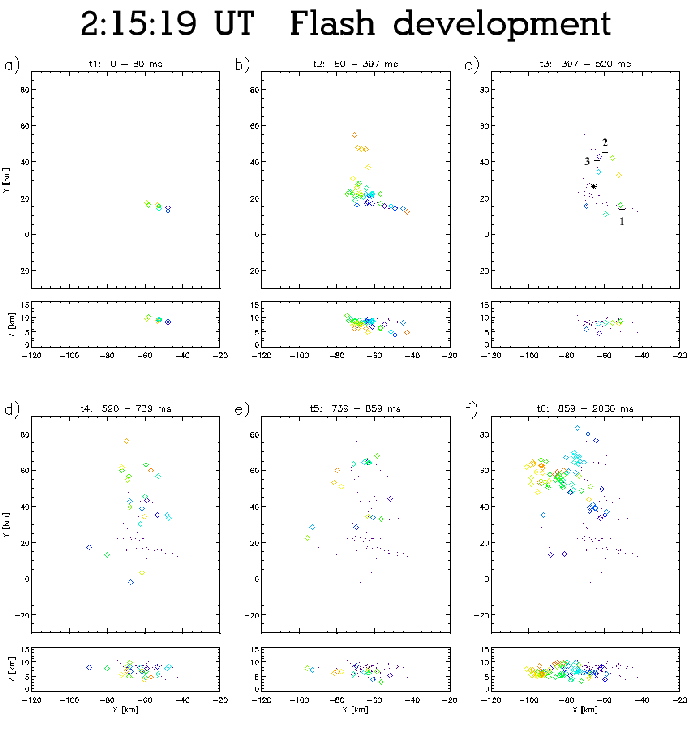
The temporal and spatial development of the flash is shown in Figures 3.23 and 3.24. The initial development of the flash during the first 2 time intervals was similar to the sprite-producing flashes, with the notable exception of a significantly smaller areal extent.
The first, most energetic, +CG occurred at the start of interval t3. This +CG differred from the previous sprite-producing +CGs in several respects. The most obvious discrepancy was its location, which was directly below the convective cell where the IC initiated (see Figure 3.24c). Another difference was that the electric field did not deflect upwards prior to the +CG. In previous discharges, the upward deflection was speculatively attributed to the net upward transport of negative charge by positive leaders propagating at/to lower altitude, after a significant portion of the discharge between the convective cell and the negative leaders had become nonconductive. The lack of this upward deflection suggests that the horizontal channels never became resistive. The net outward motion of negative charge throughout interval t2 was maintained right up to the moment of contact of a positive leader with the ground.
If the channels were still conducting along the full extent of the
discharge, then the LDAR-indicated charge center location might have
been a reasonable approximation to the average charge distance. If
this were the case, then this +CG would have produced the largest
charge moment change of the +CGs listed in Table 3.1.
It would be surprising if there were no sprites initiated by such a
large charge moment change. The factor of ![]() 3 difference between
the charge moment calculated from the NLDN and LDAR data illustrates
how important an accurate determination of range is, particularly for
closer flashes where a given uncertainty in range will comprise a
bigger percentage of the total range. It is possible that the
electric field increase was dominated by one or more negative leaders
which were much closer than the others.
3 difference between
the charge moment calculated from the NLDN and LDAR data illustrates
how important an accurate determination of range is, particularly for
closer flashes where a given uncertainty in range will comprise a
bigger percentage of the total range. It is possible that the
electric field increase was dominated by one or more negative leaders
which were much closer than the others.
 |
The electric field waveforms for the 02:15:19 UT +CGs are shown in Figures 3.25 and 3.26. As was discussed previously, the first +CG at 02:15:19.419 UT was much closer than the others and this at least partly explains its larger magnitude.
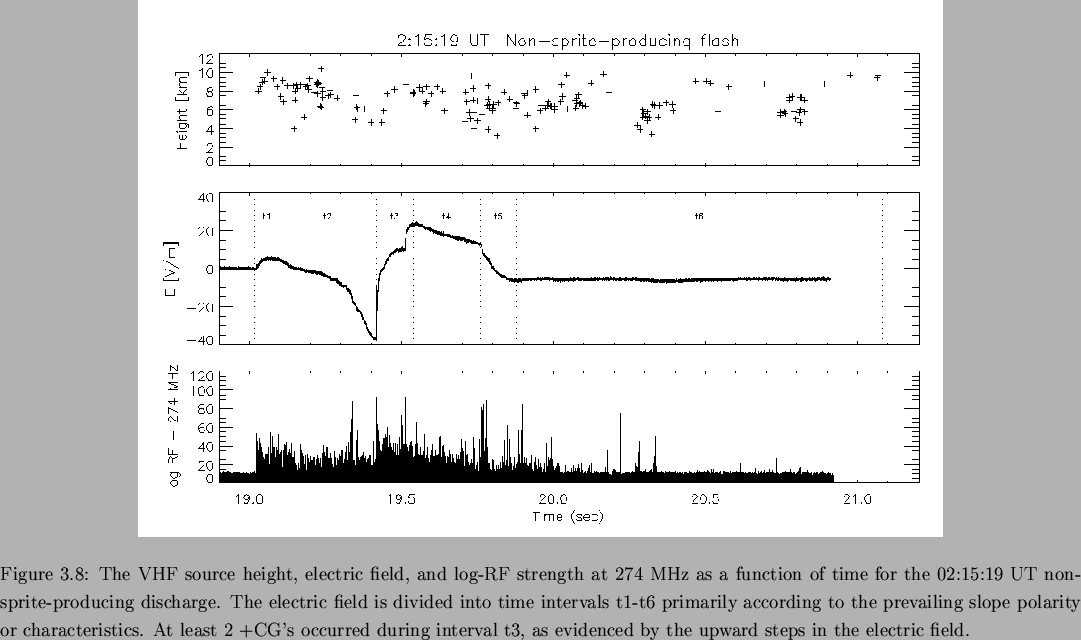
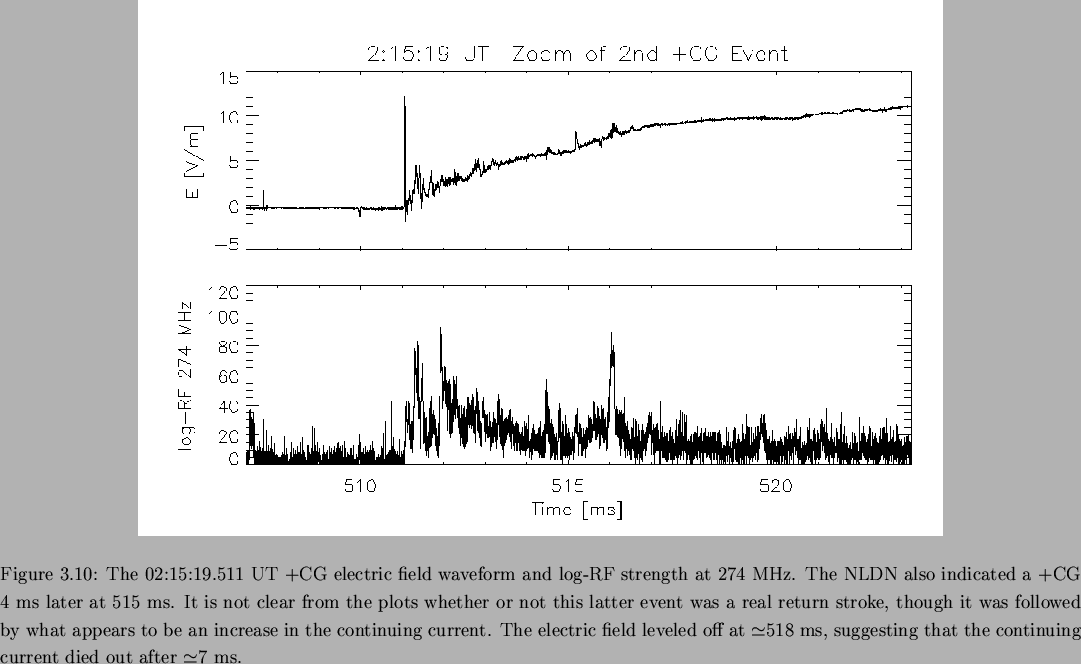
The waveforms of the 02:15:19.51 UT non-sprite-producing +CG(s) are shown in Figure 3.26. The 29.4 kA +CG at 511 ms was followed by a continuing current, which like the other +CGs, had noisy impulsive events superimposed. The continuing current persisted until at least 0.5 ms before the NLDN-indicated subsequent 4.9 kA +CG stroke at 515 ms. If the continuing current was still in effect, then this can not be a return stroke. A subtle but real increase in the overall slope of the electric field apparently followed the NLDN-indicated ``stroke''.