The fourth sprite-producing discharge occurred at 01:55:47 UT. The
video sequence for this event is shown in
Figure 3.18. This sprite cluster was not as
bright as the previous one, but the heads of the sprites still
saturated the camera. A few small sprites are also visible on each
side of the bright sprite cluster. The first video frame began at
1:55:47.953 UT, ![]() 3 ms before the occurrence of the +CG stroke.
3 ms before the occurrence of the +CG stroke.
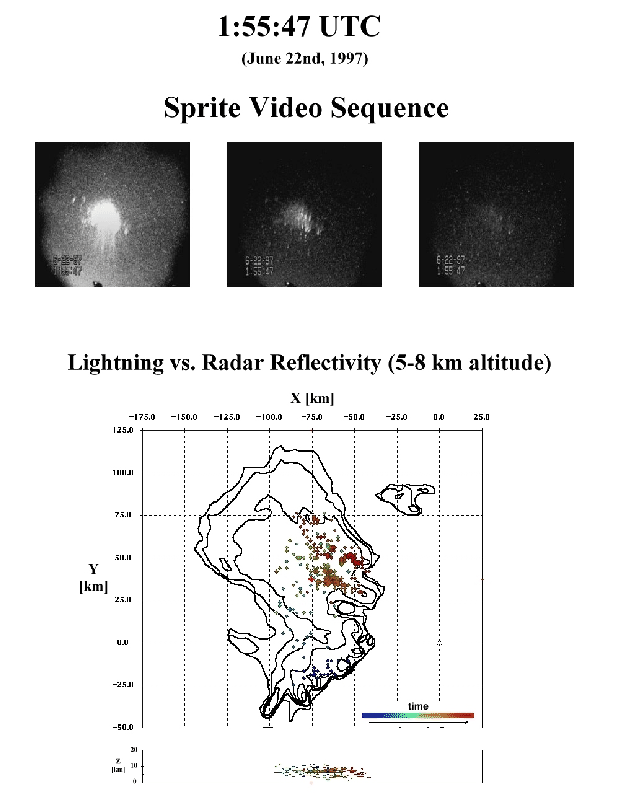 |
Figure 3.18 shows that the flash originated in a convective cell immediately to the southwest of the convective cell which initiated the 01:47:52 UT flash. Thus, it appears that all of the sprite-producing discharges up to and including this discharge originated in a different convective cell. In spite of this, all of the flashes propagated into the same charge region within the stratiform region.
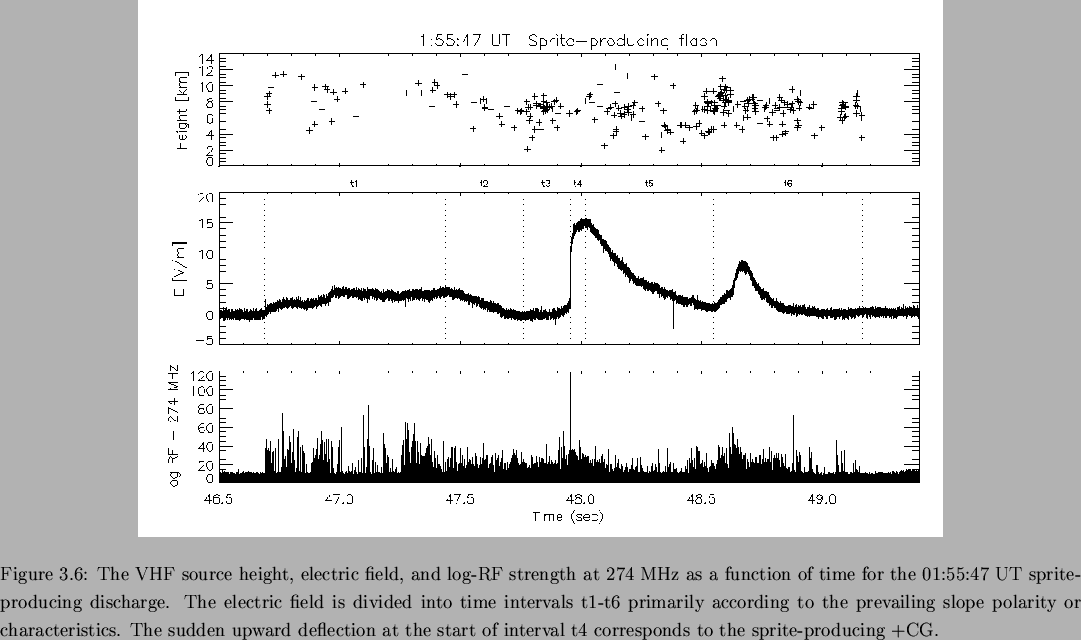
The temporal development of the flash is detailed in Figures 3.19 and 3.20. The initial increase in the electric field in interval t1 was due to the vertical development of the IC flash. The magnitude of this increase was less than that shown for previous sprite-producing flashes due to the greater range.
The negative leaders propagated outward through the stratiform region
for ![]() 20 km during interval t1, but the electric field did not
change significantly since the motion was primarily tangential
relative to the slow antenna. The negative leaders continued their
northward progression during interval t2 and the electric field
decreased due to a net outward motion of negative charge away from the
slow antenna. The average negative leader speed during interval t2
was
20 km during interval t1, but the electric field did not
change significantly since the motion was primarily tangential
relative to the slow antenna. The negative leaders continued their
northward progression during interval t2 and the electric field
decreased due to a net outward motion of negative charge away from the
slow antenna. The average negative leader speed during interval t2
was ![]() 1.1
1.1![]() 10
10![]() m/s.
m/s.
The electric field stabilized during interval t3 and even increased towards the end of the interval. Figure 3.20c indicates that the negative leaders were still progressing outwards throughout the interval, so one would expect the electric field to have decreased. It is possible that a vertical moment due to ``VHF quiet'' positive leaders propagating at lower altitude is responsible for the discrepancy.
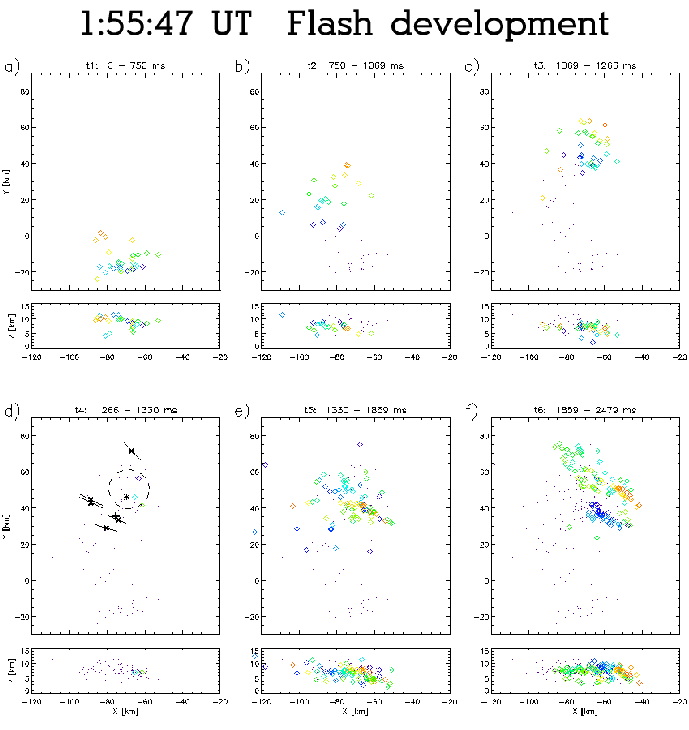 |
A 85.5 kA +CG occurred at 01:55:47.9564 UT, the start of interval t4. The sprite cluster location was determined in the same way as the 1:51:02 UT sprite cluster (see Section 3.8). The sprite cluster was well correlated with the most recent negative leader activity as well as with the LDAR-indicated charge center derived from that activity. As with all previous sprite events, the +CG was displaced from the center of sprite activity in the direction opposite of the negative leader advancement. Several of the individual sprites were near or just beyond the periphery of the discharge, though one sprite was almost directly over the +CG.
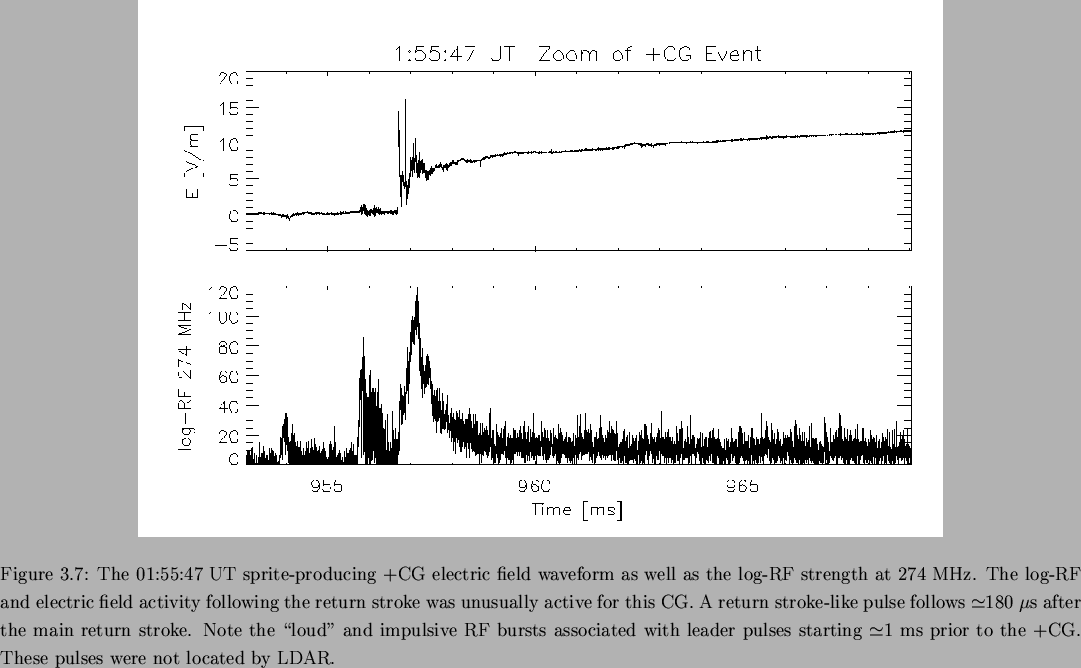
The electric field waveform of the +CG is shown in
Figure 3.21 along with the log-RF at 274 MHz. The
most dramatic increase in electric field occurred within the initial
![]() 300
300 ![]() s after the return stroke onset. Continuing current
was readily evident up to about 2.5 ms after the return stroke, at
which point the electric field increased more gradually.
s after the return stroke onset. Continuing current
was readily evident up to about 2.5 ms after the return stroke, at
which point the electric field increased more gradually.
This +CG is unusual in several respects compared to the others.
First, there was a field change resembling a return stroke
![]() 180
180 ![]() s after the +CG. The delay was too short and the
slant angle to the ionosphere was too great for this to have been an
ionospheric reflection. The cause of this field change is unknown.
Second, the +CG was preceeded for a full millisecond by stepped leader
pulses, as evidenced by the log-RF bursts and noisy electric field
prior to the +CG. The pulses were not located by LDAR. Finally, the
log-RF within the initial millisecond was stronger than that of the
other sprite-producing +CGs, possibly indicating that there was
unusually vigorous negative leader activity. This shows that there
can be significant differences between sprite-producing +CGs, the
interpretation and effects of which are not yet understood.
s after the +CG. The delay was too short and the
slant angle to the ionosphere was too great for this to have been an
ionospheric reflection. The cause of this field change is unknown.
Second, the +CG was preceeded for a full millisecond by stepped leader
pulses, as evidenced by the log-RF bursts and noisy electric field
prior to the +CG. The pulses were not located by LDAR. Finally, the
log-RF within the initial millisecond was stronger than that of the
other sprite-producing +CGs, possibly indicating that there was
unusually vigorous negative leader activity. This shows that there
can be significant differences between sprite-producing +CGs, the
interpretation and effects of which are not yet understood.
The post-sprite development of the flash (Figure 3.20e-f) was similar to that of previous sprite-producing flashes. The slow electric field change at the start of interval t6 (see Figure 3.19) was due to negative breakdown which first propagated towards the slow antenna and then away, as evidenced by the blue data points in Figure 3.20f. Comparison of Figures 3.18 and 3.3 shows that the forward (towards) motion of the negative breakdown was directed into the convective cell which initiated the 01:42:57 UT sprite-producing flash.
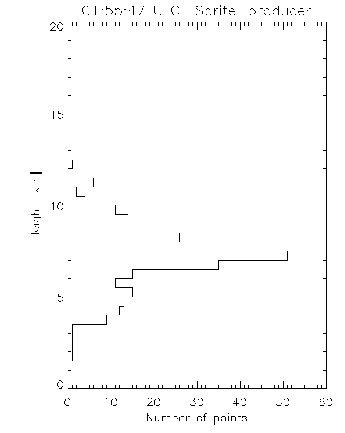 |
The height distribution of VHF sources for the 01:55:47 UT flash is
shown in Figure 3.22. The density peak at
7-8 km altitude corresponded to the average charge removal height of
the +CG. Assuming an average height of ![]() 7.5 km altitude and the
LDAR-indicated charge moment change in Table 3.1, the
charge transferred to ground (-Z direction) would have been 37 C at
1 ms and 54 C at 4 ms. The average current to ground for these
intervals would have been 37 kA and 14 kA respectively.
7.5 km altitude and the
LDAR-indicated charge moment change in Table 3.1, the
charge transferred to ground (-Z direction) would have been 37 C at
1 ms and 54 C at 4 ms. The average current to ground for these
intervals would have been 37 kA and 14 kA respectively.