Shortly after 18:00 UT on October 6, 1997, scattered thunderstorm cells formed along a roughly north-south corridor to the east of the Rio Grande in central New Mexico. Some of the cells clustered together, particularly in southern New Mexico, but the storms were not well organized as a whole. The storms in southern New Mexico organized into a mesoscale convective system (MCS) after 23:00 UT. The line of convection advanced eastward and was still active at 01:30 UT on October 7, as shown in Figure 5.1 by the line of -CG activity.
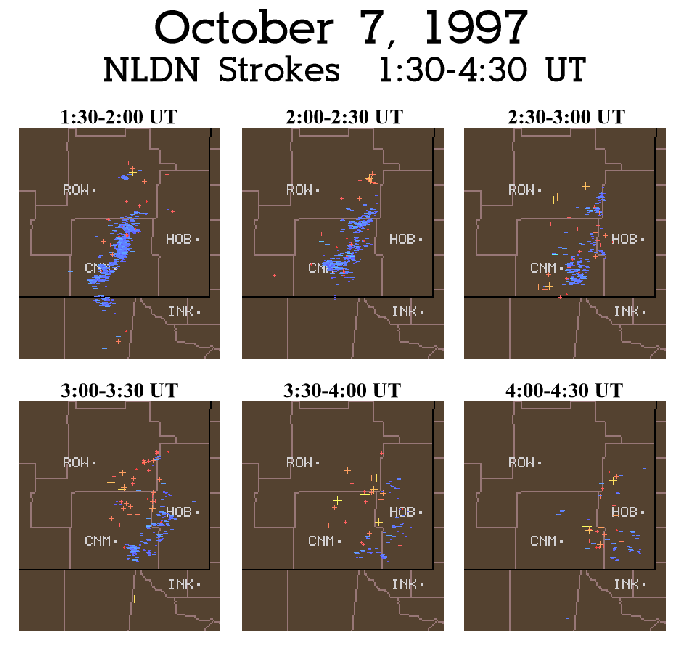 |
Figure 5.1 shows that the convective line became
less active after 02:30 UT with only infrequent -CG strokes occuring
by 04:30 UT. In contrast, the +CG activity increased after 02:30 UT,
particularly in the region behind the northern half of the line where
significant -CG activity was located much earlier (not shown). These
+CGs were centered ![]() 300 km away from the observation site at
Langmuir Laboratory. The weak amplitude +CGs prevalent throughout the
time period are probably IC events, as discussed in
Section 3.4.
300 km away from the observation site at
Langmuir Laboratory. The weak amplitude +CGs prevalent throughout the
time period are probably IC events, as discussed in
Section 3.4.
It was shown in Chapter 3 that sprite-producing +CGs were
situated near the periphery of a sprite cluster in a Florida MCS. The
center of the sprite clusters were generally located at a greater plan
distance from the convective cells than were the +CGs, a fact which
was attributed to the outward motion of the negative leaders and the
decay of older channels. Thus, one can obtain a rough estimate of
where the sprite clusters will be located in relation to their parent
+CGs by comparing the +CG locations with the convective cell locations
indicated by the ![]() CG activity. The sprite-producing flashes
analyzed here occurred between 03:00 and 04:00 UT. The +CGs were
situated primarily to the northwest of the convective line. The
observation site at Langmuir Laboratory was situated to the
west-northwest of the +CGs, so it follows that the sprites will tend
to appear both to the left of the +CGs and at a closer range. This
latter effect will result in a systematic increase in height estimates
obtained from the plan location of the NLDN CG data, relative to
actual heights. This will be further demonstrated in this section by
comparing sprite terminal altitudes estimated from the NLDN plan
location with previous triangulated measurements of terminal
altitudes.
CG activity. The sprite-producing flashes
analyzed here occurred between 03:00 and 04:00 UT. The +CGs were
situated primarily to the northwest of the convective line. The
observation site at Langmuir Laboratory was situated to the
west-northwest of the +CGs, so it follows that the sprites will tend
to appear both to the left of the +CGs and at a closer range. This
latter effect will result in a systematic increase in height estimates
obtained from the plan location of the NLDN CG data, relative to
actual heights. This will be further demonstrated in this section by
comparing sprite terminal altitudes estimated from the NLDN plan
location with previous triangulated measurements of terminal
altitudes.