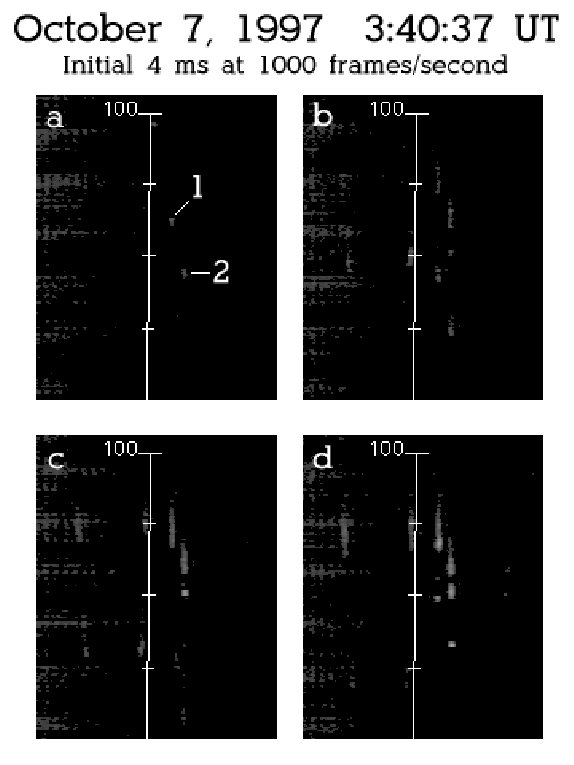
A 42.5 kA peak-current +CG occurred at 3:40:37.832 UT.
Figure 5.7 shows the development of a cluster of
columniform sprites which were produced by the +CG. The apparent
initiation of a couple of sprites in frame ![]() was delayed by
was delayed by
![]() 2-3 ms after the +CG. Based on the height above the +CG
(shown in 10 km increments), the sprite
2-3 ms after the +CG. Based on the height above the +CG
(shown in 10 km increments), the sprite ![]() luminosity in frame
luminosity in frame ![]() was between 77.3 and 78.2 km MSL altitude. Sprite
was between 77.3 and 78.2 km MSL altitude. Sprite ![]() appeared to
reach an upper terminal altitude of about 88 km in frame
appeared to
reach an upper terminal altitude of about 88 km in frame ![]() based on
the height above the +CG. Assuming an upper terminal altitude of
based on
the height above the +CG. Assuming an upper terminal altitude of
![]() 87 km (Wescott et al., 1998) would shift the apparent
initiation altitude down by only
87 km (Wescott et al., 1998) would shift the apparent
initiation altitude down by only ![]() 1 km to 76-77 km.
1 km to 76-77 km.
 |
Sprite ![]() reached an apparent upper terminal altitude of about
94 km MSL in frame
reached an apparent upper terminal altitude of about
94 km MSL in frame ![]() based on the height above the +CG. Assuming an
upper terminal altitude of
based on the height above the +CG. Assuming an
upper terminal altitude of ![]() 87 km MSL, the initial luminosity
of sprite
87 km MSL, the initial luminosity
of sprite ![]() in frame
in frame ![]() was between 78.1 and 79.0 km MSL altitude.
This is about 2 km higher than the initial luminosity of sprite
was between 78.1 and 79.0 km MSL altitude.
This is about 2 km higher than the initial luminosity of sprite ![]() (for the same terminal altitude). However, the heights based on an
upper terminal altitude of 87 km for the sprites are in better
agreement than the heights obtained relative to the +CG, which differ
by about 7 km. An initiation height of 76-79 km MSL was found to be
typical of most sprites in this study.
(for the same terminal altitude). However, the heights based on an
upper terminal altitude of 87 km for the sprites are in better
agreement than the heights obtained relative to the +CG, which differ
by about 7 km. An initiation height of 76-79 km MSL was found to be
typical of most sprites in this study.
Sprite ![]() developed downward to 69.5 km MSL altitude in frame
developed downward to 69.5 km MSL altitude in frame ![]() at
an average velocity of
at
an average velocity of
![]() m/s. It developed further
downward to a lower terminal altitude of 62.8 km MSL in frame
m/s. It developed further
downward to a lower terminal altitude of 62.8 km MSL in frame ![]() .
The minimum downward velocity in frame
.
The minimum downward velocity in frame ![]() was
was
![]() m/s. The downward velocities of the other
sprites in the cluster were very similar. These velocities are less
than predicted by Raizer et al. (1998) and were also less than the
average velocities shown for the 3:03:59 UT sprite cluster, which
appeared to initiate at a lower altitude of about 73 km MSL
(Section 5.2.3).
m/s. The downward velocities of the other
sprites in the cluster were very similar. These velocities are less
than predicted by Raizer et al. (1998) and were also less than the
average velocities shown for the 3:03:59 UT sprite cluster, which
appeared to initiate at a lower altitude of about 73 km MSL
(Section 5.2.3).