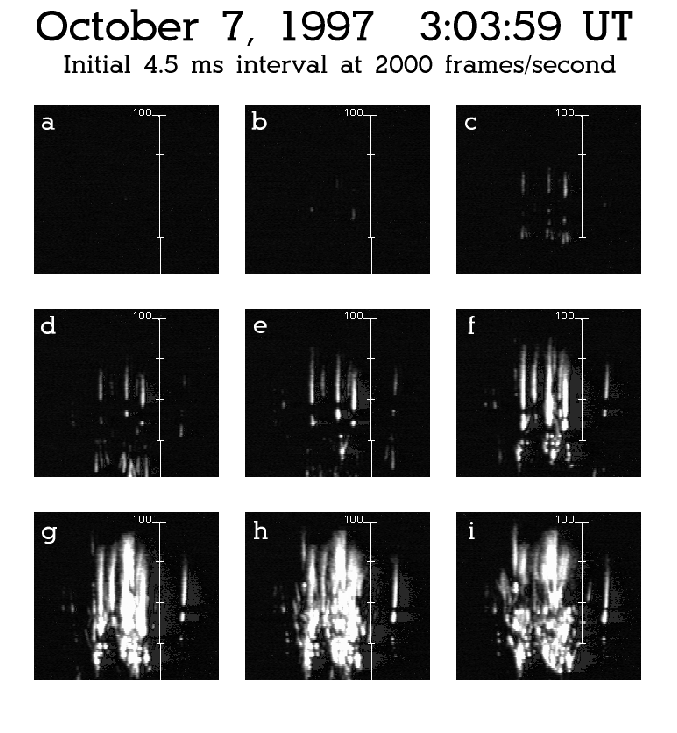
The fourth high-speed video trigger on October 7 was obtained at 03:03:59 UT. It was also the first trigger on the 7th to successfully capture a sprite. The observations were of a cluster of carrot sprites at a video rate of 2000 frames/second. The sprites were associated with a 30 kA +CG at 332 km range. Development of the cluster is shown in Figures 5.2-5.3.
 |
 |
The start of light integration for the first frame (Figure 5.2a) was at 03:03:59.8067 UT. The integration of light in the frame is not performed simultaneously, as discussed in Appendix B.4.2. Rather, a video frame recorded at 2000 frames/second is composed of 6 horizontal blocks each of which is integrated discretely.
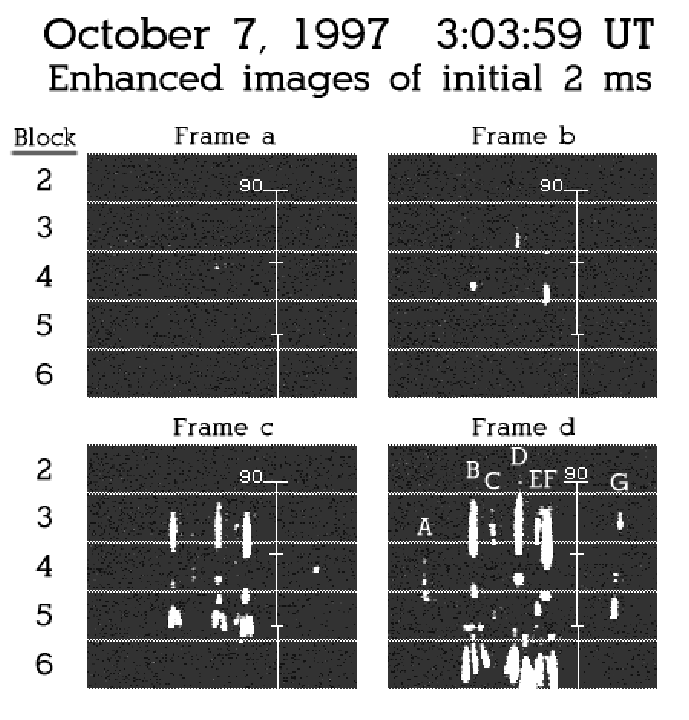
Figure 5.4 shows the first four frames of the sprite
cluster development (Figures 5.2a-d) with the pixel
intensities stretched such that faint sprite features are readily
visible. The horizontal lines correspond to the location of block
boundaries, with the uppermost block (block 1) excluded from the
images. The block boundary locations will factor into the velocity
estimates of vertical sprite development, since the time elapsed
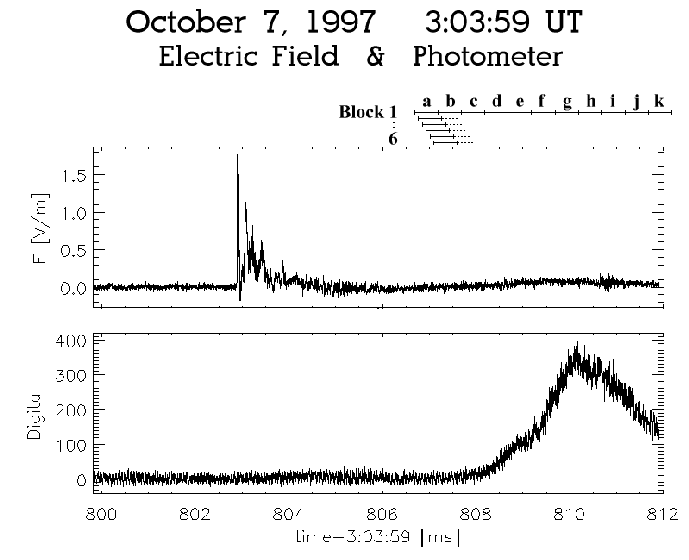
between frames depends on the block number. The start and stop times
of light integration for the high-speed video blocks is shown in
Figure 5.5 relative to electric field and
photometer data. Frame ![]() is delayed by
is delayed by ![]() 4 ms after the +CG.
4 ms after the +CG.
 |
 |
Seven distinct sprites formed within the first four frames. The
sprites are labeled from left to right in frame ![]() of
Figure 5.4. The vertical bar denotes altitude in
kilometers MSL directly above the parent +CG stroke with the tick
marks indicating 10 km height intervals.
of
Figure 5.4. The vertical bar denotes altitude in
kilometers MSL directly above the parent +CG stroke with the tick
marks indicating 10 km height intervals.
Sprite D apparently formed first, as evidenced by the single sensor
pixel illuminated in the first frame. If the plan distance to the
sprite were the same as to the parent +CG, then this luminous spot
would have been at an altitude of 79.3 km MSL. The maximum altitude
of sprite D would have been ![]() 98 km MSL (see frame h of
Figure 5.2) if the sprite was located at the same plan
location as the +CG. Triangulation studies of sprites indicate that
the maximum altitude generally does not exceed
98 km MSL (see frame h of
Figure 5.2) if the sprite was located at the same plan
location as the +CG. Triangulation studies of sprites indicate that
the maximum altitude generally does not exceed ![]() 93 km MSL
(Sentman et al., 1995). Thus, it is likely that the plan location of
sprite D was closer than that of the +CG. In Chapter 3,
an upper terminal altitude of 87 km MSL was used to determine the most
likely range of sprites. The 03:03:59 UT sprites were brighter than
average, so the terminal altitude was probably higher than 87 km.
Unless stated otherwise, the height and velocity estimates in this
section will be based on the assumption that the terminal altitude of
each sprite was
93 km MSL
(Sentman et al., 1995). Thus, it is likely that the plan location of
sprite D was closer than that of the +CG. In Chapter 3,
an upper terminal altitude of 87 km MSL was used to determine the most
likely range of sprites. The 03:03:59 UT sprites were brighter than
average, so the terminal altitude was probably higher than 87 km.
Unless stated otherwise, the height and velocity estimates in this
section will be based on the assumption that the terminal altitude of
each sprite was ![]() 90 km MSL.
90 km MSL.
The range to sprite D would have been 306 km for a 90 km MSL terminal
altitude. With this assumption, the plan location of the sprite would
have been at least 26 km away from the parent +CG stroke location.
This is a reasonable distance since triangulated measurements of
sprites show that their plan location can be as far as ![]() 50 km
away from the parent +CG (Lyons, 1996; Wescott et al., 1998) (also
see Chapter 3).
50 km
away from the parent +CG (Lyons, 1996; Wescott et al., 1998) (also
see Chapter 3).
The initial luminosity from sprite D was at ![]() 72.9 km MSL
altitude. The sprite developed both upward to
72.9 km MSL
altitude. The sprite developed both upward to ![]() 78.0 km MSL
and downward to
78.0 km MSL
and downward to ![]() 68.4 km MSL in frame
68.4 km MSL in frame ![]() with the minimum
altitude barely visible as a single illuminated sensor pixel at the
top of block 5. The maximum altitude of the sprite in frame
with the minimum
altitude barely visible as a single illuminated sensor pixel at the
top of block 5. The maximum altitude of the sprite in frame ![]() was
one block higher than the starting point in frame
was
one block higher than the starting point in frame ![]() . Thus, the time
elapsed for the upward development was
. Thus, the time
elapsed for the upward development was
![]() ms. The average upward development
velocity of sprite D in frame
ms. The average upward development
velocity of sprite D in frame ![]() was therefore
was therefore
![]() m/s.
The minimum altitude was one block lower than the starting point with
a time elapsed for downward development of
m/s.
The minimum altitude was one block lower than the starting point with
a time elapsed for downward development of
![]() ms. The average downward
development velocity of sprite D in frame
ms. The average downward
development velocity of sprite D in frame ![]() was therefore
was therefore
![]() m/s.
m/s.
Sprite D continued to develop bidirectionally into frame c, extending
up to about 80.0 km MSL altitude and down to about 63.7 km MSL in the
right tendril branch (about 64.1 km MSL for the left). Sprite D's
average upward development velocity in frame ![]() was therefore
was therefore
![]() m/s while its average downward velocity was
m/s while its average downward velocity was
![]() m/s. The average downward velocity estimate does
not factor in the slight non-vertical motion of the tendril, the
radial component of which can not be determined without triangulation.
m/s. The average downward velocity estimate does
not factor in the slight non-vertical motion of the tendril, the
radial component of which can not be determined without triangulation.
The average downward velocity increased from frame ![]() to frame
to frame ![]() while the average upward velocity decreased by a factor of three. The
increase and magnitude of the downward velocity is roughly consistent
with the theoretical predictions of positive streamer velocities in
sprites by Raizer et al. (1998) for a similar altitude extent.
while the average upward velocity decreased by a factor of three. The
increase and magnitude of the downward velocity is roughly consistent
with the theoretical predictions of positive streamer velocities in
sprites by Raizer et al. (1998) for a similar altitude extent.
In frame ![]() , sprite D extended up to
, sprite D extended up to ![]() 82.8 km MSL altitude
while the right main branch of tendrils had extended below the field
of view at
82.8 km MSL altitude
while the right main branch of tendrils had extended below the field
of view at ![]() 56.6 km MSL altitude. The average downward
velocity for the right main branch of tendrils would have been
56.6 km MSL altitude. The average downward
velocity for the right main branch of tendrils would have been
![]() m/s. The average downward velocity for the
left main branch of tendrils, which was still completely in the field
of view, was
m/s. The average downward velocity for the
left main branch of tendrils, which was still completely in the field
of view, was
![]() m/s. Thus, the right main branch of
tendrils may have extended only slightly below the field of view. The
average downward velocity in frame
m/s. Thus, the right main branch of
tendrils may have extended only slightly below the field of view. The
average downward velocity in frame ![]() was greater than in frame
was greater than in frame ![]() and is the same as the maximum velocity of
and is the same as the maximum velocity of
![]() m/s
predicted by Raizer et al. (1998) for a similar total altitude
extent.
m/s
predicted by Raizer et al. (1998) for a similar total altitude
extent.
Sprite B developed in a similar fashion as sprite D. Sprite B was
first visible as three illuminated pixels in a vertical column in
frame ![]() . The altitude extent of this region was
. The altitude extent of this region was
![]() 72.6-73.6 km, consistent with the
72.6-73.6 km, consistent with the ![]() 72.9 km MSL
origin of sprite D which was also determined on the assumption of a
72.9 km MSL
origin of sprite D which was also determined on the assumption of a
![]() 90 km MSL terminal altitude. In contrast, the altitude
derived from the range to the +CG would have been 76.2-77.2 km MSL, at
least 2 km lower than the sprite D origin of 79.3 km MSL based on the
same range.
90 km MSL terminal altitude. In contrast, the altitude
derived from the range to the +CG would have been 76.2-77.2 km MSL, at
least 2 km lower than the sprite D origin of 79.3 km MSL based on the
same range.
The upward developing component of sprite B reached ![]() 81.8 km
in frame
81.8 km
in frame ![]() with an average velocity of
with an average velocity of
![]() m/s,
significantly faster than the average initial upward velocity of
sprite D in frame
m/s,
significantly faster than the average initial upward velocity of
sprite D in frame ![]() . The downward-developing component of sprite B
reached
. The downward-developing component of sprite B
reached ![]() 66.5 km MSL altitude on the left tendril branch in
frame
66.5 km MSL altitude on the left tendril branch in
frame ![]() with an average downward velocity of
with an average downward velocity of
![]() m/s.
This velocity is comparable to the average downward velocity of
sprite D (
m/s.
This velocity is comparable to the average downward velocity of
sprite D (
![]() m/s) in the same frame, in spite of the
delayed appearance by one frame of initial luminosity for sprite B
relative to sprite D.
m/s) in the same frame, in spite of the
delayed appearance by one frame of initial luminosity for sprite B
relative to sprite D.
In frame ![]() , the upper extent of sprite B was at
, the upper extent of sprite B was at ![]() 83.4 km
altitude while the lower extent was at
83.4 km
altitude while the lower extent was at ![]() 59.3 km. The
corresponding average velocities were
59.3 km. The
corresponding average velocities were
![]() m/s and
m/s and
![]() m/s, respectively. The downward development
velocity was essentially identical to that of sprite D in the same
frame.
m/s, respectively. The downward development
velocity was essentially identical to that of sprite D in the same
frame.
The pattern of development of the other sprites was similar to sprites B and D. All of the sprites appeared to develop bidirectionally from the first frame to the next. This development pattern is consistent with bidirectional streamer growth observed in laboratory experiments and predicted by theory (see Section 2.6.1).
The downward development velocites were similar for all of the sprites
and did not exceed
![]() m/s. The maximum velocity was
consistent with the theoretical predictions of Raizer et al. (1998)
for the maximum velocity of a downward-developing positive streamer
under the influence of a 350 C
m/s. The maximum velocity was
consistent with the theoretical predictions of Raizer et al. (1998)
for the maximum velocity of a downward-developing positive streamer
under the influence of a 350 C![]() km parent discharge. The
downward developing tendrils also exhibited short persistence between
adjacent frames. The short persistence will be explored in more
detail in Section 5.2.5 for a sprite cluster with unusually
bright tendrils.
km parent discharge. The
downward developing tendrils also exhibited short persistence between
adjacent frames. The short persistence will be explored in more
detail in Section 5.2.5 for a sprite cluster with unusually
bright tendrils.
The maximum upward average velocity of sprite bidirectional
development was usually obtained in the second frame (the first
possible frame for an average velocity measurement). These initial
upward development velocities varied considerably from sprite to
sprite, as was already demonstrated by intercomparing sprites B and D.
The upward development velocity slowed down considerably after
attaining an altitude of ![]() 81 km, which is consistent with the
predicted altitude for the base of the ionosphere
(Section 2.4.4). However, the continued advancement above
this altitude is difficult to understand conceptually, particularly in
light of the significant minimum electric field required to sustain
negative streamer propagation (see
Section 2.6.2).
81 km, which is consistent with the
predicted altitude for the base of the ionosphere
(Section 2.4.4). However, the continued advancement above
this altitude is difficult to understand conceptually, particularly in
light of the significant minimum electric field required to sustain
negative streamer propagation (see
Section 2.6.2).
The spatially-integrated luminosity of initial sprite development in
frames ![]() and
and ![]() was below the detection threshold of the photometer
(Figure 5.5). This demonstrates that a
photometer may not give a reliable estimate of when sprites are
initiated. This difficulty is further compounded by the fact that
sprites within a sprite cluster often do not appear simultaneously.
Rather, sprite appearance can be spread out over several milliseconds,
as was the case here. Another (initially faint) sprite appeared in
frame
was below the detection threshold of the photometer
(Figure 5.5). This demonstrates that a
photometer may not give a reliable estimate of when sprites are
initiated. This difficulty is further compounded by the fact that
sprites within a sprite cluster often do not appear simultaneously.
Rather, sprite appearance can be spread out over several milliseconds,
as was the case here. Another (initially faint) sprite appeared in
frame ![]() to the left of sprite A while two more sprites appeared in
frame
to the left of sprite A while two more sprites appeared in
frame ![]() , one just to the left of sprite B while the other was
between sprites F and G. There may also have been additional sprites
which formed behind the main cluster of sprites (B-F) after frame
, one just to the left of sprite B while the other was
between sprites F and G. There may also have been additional sprites
which formed behind the main cluster of sprites (B-F) after frame ![]() .
.
The tendrils of sprites B, D, and F propagated downward out of the
field of view in Figure 5.2e. A tendril segment above a
branch point brightened significantly in frame ![]() on sprite D's right
main tendril branch. The lower columnar portion of sprite B
brightened and also bulged outward on the right side. This bulge
probably was the beginning of an inferred negative streamer which
propagated upward and to the right in frame
on sprite D's right
main tendril branch. The lower columnar portion of sprite B
brightened and also bulged outward on the right side. This bulge
probably was the beginning of an inferred negative streamer which
propagated upward and to the right in frame ![]() .
.
Additional tendril segments brightened in frame ![]() . A striking
feature is that the brightening occurred in the form of regularly
spaced beads. Such beads were previously observed on tendrils by
Mende et al. (1999). The tendril segments which brightened first on
sprites B, D, and F were also the segments which propagated the
furthest downward in frame
. A striking
feature is that the brightening occurred in the form of regularly
spaced beads. Such beads were previously observed on tendrils by
Mende et al. (1999). The tendril segments which brightened first on
sprites B, D, and F were also the segments which propagated the
furthest downward in frame ![]() relative to other segments associated
with the same sprites (Figure 5.2d). A speculative
possibility is that the lower altitudes (and faster propagation
speeds) of the positive streamers were also associated with higher
currents in the channels and this led to the subsequent brightening.
However, it is not known how this could have produced a regular
spacing of beads.
relative to other segments associated
with the same sprites (Figure 5.2d). A speculative
possibility is that the lower altitudes (and faster propagation
speeds) of the positive streamers were also associated with higher
currents in the channels and this led to the subsequent brightening.
However, it is not known how this could have produced a regular
spacing of beads.
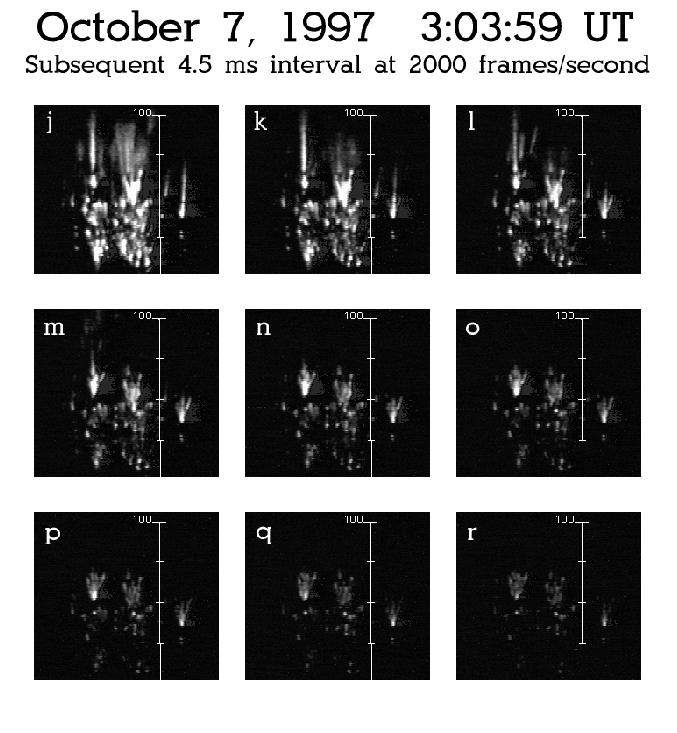
The development of sprite B through frames ![]() -
-![]() is shown in
Figure 5.6. In this sequence, sprite B transitioned
from a columniform sprite with tendrils to a carrot sprite, which is
characterized by an upward-divergent ``V'' shape above
downward-divergent tendrils. The sequence shows primarily the
development on the left side of sprite B, since sprite C obscures much
of the development on the right.
is shown in
Figure 5.6. In this sequence, sprite B transitioned
from a columniform sprite with tendrils to a carrot sprite, which is
characterized by an upward-divergent ``V'' shape above
downward-divergent tendrils. The sequence shows primarily the
development on the left side of sprite B, since sprite C obscures much
of the development on the right.
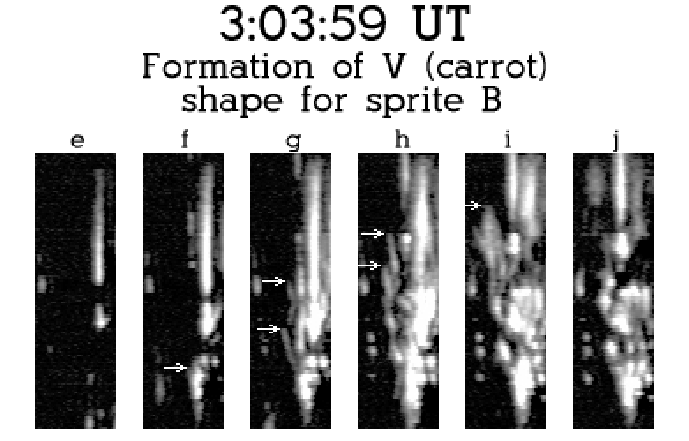 |
In frame ![]() of Figure 5.6, an inferred negative
streamer began its upward-propagation from the left tendril branch of
sprite B. The arrow in frame
of Figure 5.6, an inferred negative
streamer began its upward-propagation from the left tendril branch of
sprite B. The arrow in frame ![]() denotes the streamer's tip location,
which was at
denotes the streamer's tip location,
which was at ![]() 65.5 km MSL altitude. The streamer propagated up
to
65.5 km MSL altitude. The streamer propagated up
to ![]() 69.9 km MSL (lower arrow) in frame
69.9 km MSL (lower arrow) in frame ![]() at an average angle
of
at an average angle
of ![]() from vertical. The corresponding average velocity of
propagation was
from vertical. The corresponding average velocity of
propagation was
![]() m/s if there was no radial
component. The average velocity would have been somewhat greater if
there was a radial component. This streamer continued its upward
propagation in frame
m/s if there was no radial
component. The average velocity would have been somewhat greater if
there was a radial component. This streamer continued its upward
propagation in frame ![]() at a reduced angle relative to vertical and
had split several times. The uppermost tip is denoted by the lower
arrow in frame
at a reduced angle relative to vertical and
had split several times. The uppermost tip is denoted by the lower
arrow in frame ![]() at an altitude of
at an altitude of ![]() 76.8 km MSL. The
corresponding average velocity of upward-propagation was
76.8 km MSL. The
corresponding average velocity of upward-propagation was
![]() m/s, which was significantly greater than the
average velocity in the previous frame.
m/s, which was significantly greater than the
average velocity in the previous frame.
The negative streamer continued its upward-development into frame ![]() to an altitude of
to an altitude of ![]() 84.2 km MSL (see arrow). The average
streamer velocity of
84.2 km MSL (see arrow). The average
streamer velocity of
![]() m/s in frame
m/s in frame ![]() was only
slightly greater than in frame
was only
slightly greater than in frame ![]() . The width of the streamer
increased noticeably in frame
. The width of the streamer
increased noticeably in frame ![]() and this is even more pronounced in
frame
and this is even more pronounced in
frame ![]() . This expansion may be associated with penetration of the
streamer into the ionosphere above
. This expansion may be associated with penetration of the
streamer into the ionosphere above ![]() 81 km MSL. The streamer
reached a terminal altitude of
81 km MSL. The streamer
reached a terminal altitude of ![]() 89.8 km MSL in frame
89.8 km MSL in frame ![]() with
an average velocity which would have been greater than
with
an average velocity which would have been greater than
![]() m/s.
m/s.
The inferred negative streamer which presumably originated within the
column reached an altitude of ![]() 75.0 km MSL (upper arrow) in
frame
75.0 km MSL (upper arrow) in
frame ![]() . The point of origin is difficult to determine due to the
development of foreground tendrils from a sprite which originated in
frame
. The point of origin is difficult to determine due to the
development of foreground tendrils from a sprite which originated in
frame ![]() just to the left of sprite B. However, the point of origin
is likely correlated with the bulge at
just to the left of sprite B. However, the point of origin
is likely correlated with the bulge at ![]() 70.7 km MSL. This
bulge is opposite the origin of the inferred negative streamer which
originated in frame
70.7 km MSL. This
bulge is opposite the origin of the inferred negative streamer which
originated in frame ![]() and propagated to the right and upwards. The
leftward streamer propagated up at an average angle of
and propagated to the right and upwards. The
leftward streamer propagated up at an average angle of ![]() relative to vertical and an average velocity which would have been
greater than
relative to vertical and an average velocity which would have been
greater than
![]() m/s. This streamer continued up to an
altitude of
m/s. This streamer continued up to an
altitude of ![]() 80.9 km MSL (upper arrow) in frame
80.9 km MSL (upper arrow) in frame ![]() at an
average velocity of
at an
average velocity of
![]() m/s and terminated at a slightly
higher altitude in frame i.
m/s and terminated at a slightly
higher altitude in frame i.
Numerous negative streamers initiated and developed in frames ![]() -
-![]() of Figures 5.2-5.3. The formation of
negative streamers in each sprite was not simultaneous across the
cluster, but was staggered in rough accordance with the different
initiation times. The negative streamer velocities were similar to
those reported above.
of Figures 5.2-5.3. The formation of
negative streamers in each sprite was not simultaneous across the
cluster, but was staggered in rough accordance with the different
initiation times. The negative streamer velocities were similar to
those reported above.