The high-speed video timing was calibrated in a way similar to that originally used for the normal-speed video: with an LED in the field of view. The LED was connected through a resistor to the GPS-based binary coded decimal (BCD) 100 ms bit. The LED would be on during odd hundred millisecond intervals and off for even intervals. The time of a sprite event within the normal-speed video was used to determine which odd or even 100 ms block was being observed in the high-speed video sequence.
Sub-frame accuracy timing was obtained by examining the brightness of
the LED during an on/off transition and comparing this brightness with
that when it was on for an entire frame. An LED which was observed to
be relatively dim during an on![]() off transition must have
changed state during the earlier part of the frame interval. However,
a relatively dim LED during an off
off transition must have
changed state during the earlier part of the frame interval. However,
a relatively dim LED during an off![]() on transition indicates
that the LED turned on in the latter part of the frame interval, etc.
on transition indicates
that the LED turned on in the latter part of the frame interval, etc.
 |
In order to calculate the time of the transitions, an average LED intensity was determined before, during, and after an LED transition. This procedure was complicated by the fact that the high-speed video frame is not light-integrated simultaneously. Instead, the high-speed video frame is integrated in blocks starting from the top, as explained in Section A.1. Any measurement of intensity had to be confined to within the same block.
| ||||||||||||||||||||||||||||||||||||||||||||||||||||||||||||||||
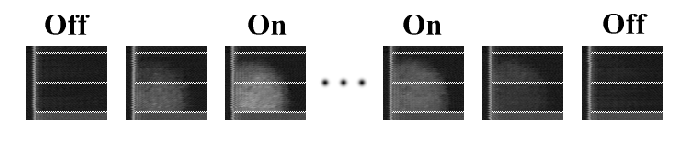
Table B.1 shows the timing calibration procedure which
was used for the 4:37:05 UT sprite event on October 6, 1997. The
sprite event occurred between the LED transitions shown in
Figure B.3. Calculations were performed for both the
off![]() on and on
on and on![]() off transitions since the 8-bit
grayscale in the digitized image may not have been linearly
proportional to actual light intensity. By using both transitions,
any systematic error in the intensity estimate was minimized.
off transitions since the 8-bit
grayscale in the digitized image may not have been linearly
proportional to actual light intensity. By using both transitions,
any systematic error in the intensity estimate was minimized.
The timing calibration procedure was also performed for all other high speed video sequences shown in this dissertation.