The index of refraction of air is not precisely unity, but is slightly larger than unity. A non-unitary refractive index for air will cause light entering the atmosphere to bend, much like light bends when it enters a higher refractive index substance such as water. The steeper the incidence angle relative to the surface normal, the more light is refracted. The refraction of light can have a dramatic influence on the apparent positions of stars at low elevation angles. In order to properly align a star field (see Section B.3.1) at low elevation angles, the refractive bending of light must be incorporated into the calculated apparent star positions.
Sprites are at a high enough altitude and low enough air density that they can be considered external to the atmosphere in refraction calculations. Thus, the atmosphere will bend the light from sprites in essentially the same way that it does for the star field behind the sprites.
The refractive index of air, minus one, is proportional to the density of air. At 600 nm, the equation for the refractive index of dry air as a function of air density is (Weast, 1987, p. E-320):
where ![]() is the refractive index for air of density
is the refractive index for air of density
![]() and
and ![]() is the density of air at sea level. The
numerical coefficient of
is the density of air at sea level. The
numerical coefficient of ![]() is based upon a wavelength of
600 nm (red light). The multiplier will change slightly for other
visible wavelengths. The refractive index also depends somewhat on
the water content of the air. The high altitude and dry enviroment of
Langmuir Laboratory did not require that a correction be made for
moisture content. Such a correction would have been smaller than the
resolving power of the instruments used.
is based upon a wavelength of
600 nm (red light). The multiplier will change slightly for other
visible wavelengths. The refractive index also depends somewhat on
the water content of the air. The high altitude and dry enviroment of
Langmuir Laboratory did not require that a correction be made for
moisture content. Such a correction would have been smaller than the
resolving power of the instruments used.
A raytracing code was implemented to calculate the actual incident angle of starlight or ``spritelight'' for any given observed angle. A light-ray was propagated, or ``traced'', back up through the atmosphere starting at the observed angle. In this calculation, the Earth's atmosphere was approximated to a large number of discrete shells. Each shell had a refractive index corresponding to the average air density within the shell.
At each interface between shells, the angle of propagation changed slightly according to Snell's Law:
| (B.2) |
where within the ![]() shell,
shell, ![]() is the index of
refraction and
is the index of
refraction and ![]() is the light-ray angle relative to the
is the light-ray angle relative to the
![]() interface normal.
interface normal.
Since only the angle relative to the interface normal changes, the azimuth angle will not change. Refraction therefore affects only the elevation angle.
The 1976 US Standard Atmosphere model (see Section 2.3.1) was used to determine the air density for a given height. An array of refractive indices was then formed by using Equation B.1 on a uniformly spaced array of heights extending from sea-level up to a maximum altitude of 40 km. Above 40 km altitude, the air is thin enough that refractive effects can be completely neglected.
The raytracing was started from the observation altitude, which for most sprite observations reported in this paper was about 3200 m above sea-level. The raytracing procedure was performed on each element of a uniformly spaced array of observed elevation angles. Some of the observed elevation angles were even slightly negative since the horizon as viewed from a mountain observation site can be at negative angles (this fact is particularly important for the October 6, 1997 sprites). The result of these lengthy calculations was an array of incident elevation angles. A lookup table was formed which allowed one to determine the observed elevation angle given an incident angle and vice versa. This lookup table is utilized by the sprite analysis software in both the calculations of observed stellar elevation angles as well as in the observed heights of sprites.
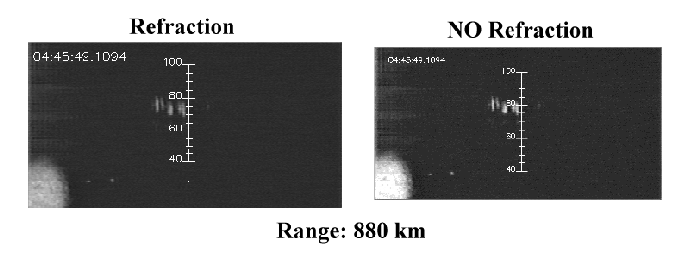 |
Figure B.4 shows how significant the effects of refraction can be for distant (low elevation angle) sprites. The camera orientation is identical for both cases and was properly determined by including the effects of refraction on star positions. The vertical bars in the images are height indicators in units of kilometers above the 880 km distant cloud-to-ground discharge which immediately preceeded the sprite event.
The vertical bar on the left in Figure B.4 was plotted with refraction taken into account. The vertical bar on the right was plotted without refractive effects. Comparing estimated heights for the same sprite features shows that ignoring refraction would have resulted in height estimates which were systematically 4-5 km too high. These systematic errors would increase for lower altitudes in a sprite event since refractive effects increase with decreasing elevation angle. (Note how the refracted vertical bar appears to be compressed at lower altitudes.)