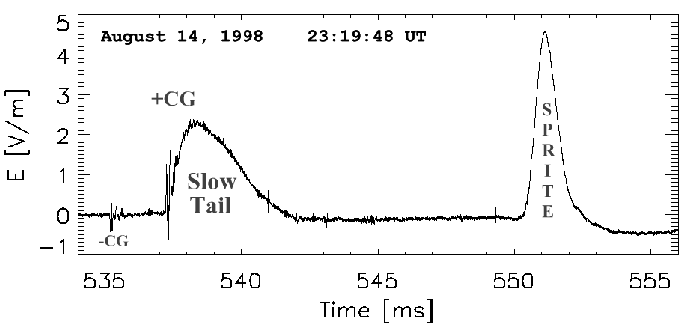
Starting at 23:19:48.535 UT, the electric field system was triggered in 3 consecutive time intervals. The broadband electric field data, sampled at 500 kHz, is shown in Figure 4.4. A -CG field change precedes a +CG field change with a large slow tail. The slow tail is followed by a large and isolated slow field change with a waveshape very similar to that produced by energetic nighttime sprites (Reising et al., 1999; Brook et al., 1997; Cummer and Stanley, 1999; Cummer et al., 1998). The +CG had a peak current of 70.9 kA and occurred in the MCS over southern Texas (see Figure 4.3) while the -CG was produced by an unrelated small storm in central Wyoming. The onset of the sprite field change occurred 13.2 ms after the +CG onset.
 |
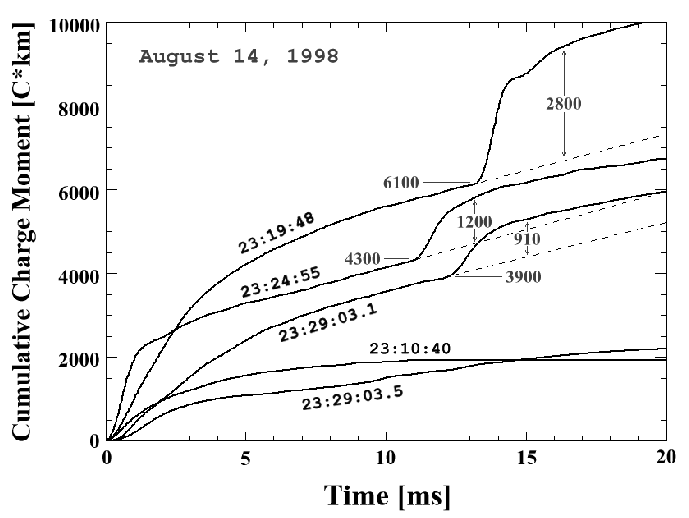
The charge moment change of the 23:19:48 UT parent +CG discharge and
sprite event are shown in Figure 4.5. The charge
moment change of the +CG at the onset of the sprite field change was
6100 C![]() km. In contrast, the onset of nighttime sprite ELF
signatures occurred at +CG charge moment changes well below
1100 C
km. In contrast, the onset of nighttime sprite ELF
signatures occurred at +CG charge moment changes well below
1100 C![]() km (Cummer and Stanley, 1999). Charge moment changes
exceeding 6000 C
km (Cummer and Stanley, 1999). Charge moment changes
exceeding 6000 C![]() km may be exceptionally rare since
Huang et al. (1999) found no charge moment changes larger than
km may be exceptionally rare since
Huang et al. (1999) found no charge moment changes larger than
![]() 5000 C
5000 C![]() km across the entire globe during an
km across the entire globe during an
![]() 18 day observation period in the summer of 1997.
18 day observation period in the summer of 1997.
 |
The charge transferred to ground by the parent +CG can be estimated by
assuming that the average charge height was no lower than
![]() 4 km, which is the base altitude of a significant positive
charge layer in stratiform regions (Marshall et al., 1996), and no
higher than the maximum cloud top height of
4 km, which is the base altitude of a significant positive
charge layer in stratiform regions (Marshall et al., 1996), and no
higher than the maximum cloud top height of ![]() 15 km indicated by
infrared satellite measurements of cloud top temperature
(Figure 4.2). From the charge moment change, the
total charge transferred to ground would therefore have been between
410 C and 1500 C prior to the onset of the sprite field change. The
largest directly measured total charge transfer that the authors are
aware of is
15 km indicated by
infrared satellite measurements of cloud top temperature
(Figure 4.2). From the charge moment change, the
total charge transferred to ground would therefore have been between
410 C and 1500 C prior to the onset of the sprite field change. The
largest directly measured total charge transfer that the authors are
aware of is ![]() 450 C (also associated with a +CG)
(Berger, 1972), which further attests to the highly energetic and
unusual nature of this event.
450 C (also associated with a +CG)
(Berger, 1972), which further attests to the highly energetic and
unusual nature of this event.
The sprite event added ![]() 2800 C
2800 C![]() km to the total charge
moment change, as indicated in Figure 4.5 by the
separation between the total charge moment change (solid line) and the
estimated parent discharge charge moment change component (dashed
line) for the 23:19:48 UT event. To put this into perspective, the
largest sprite charge moment change found by Cummer and Stanley (1999) for
11 nighttime sprite events was
km to the total charge
moment change, as indicated in Figure 4.5 by the
separation between the total charge moment change (solid line) and the
estimated parent discharge charge moment change component (dashed
line) for the 23:19:48 UT event. To put this into perspective, the
largest sprite charge moment change found by Cummer and Stanley (1999) for
11 nighttime sprite events was ![]() 840 C
840 C![]() km (see
Section 5.3.3) while Reising et al. (1999) found no sprite
charge moment changes larger than
km (see
Section 5.3.3) while Reising et al. (1999) found no sprite
charge moment changes larger than ![]() 380 C
380 C![]() km for 81
nighttime sprite events. Since nighttime sprite charge moment changes
are known to be linearly correlated with spatially-integrated sprite
brightness Reising et al. (1999), it is likely that this daytime
sprite event was unusually bright.
km for 81
nighttime sprite events. Since nighttime sprite charge moment changes
are known to be linearly correlated with spatially-integrated sprite
brightness Reising et al. (1999), it is likely that this daytime
sprite event was unusually bright.
Five minutes later at 23:24:55.658 UT, another +CG occurred within the
same region of the storm as the first (Figure 4.3)
and produced the second sprite field change. The onset of the sprite
field change occurred after 11.0 ms had elapsed when the parent
discharge charge moment change had reached 4300 C![]() km
(Figure 4.5). Although this was less than the
threshold for the previous sprite ELF signature onset, it is still far
in excess of that observed for nighttime sprites. The sprite event
added
km
(Figure 4.5). Although this was less than the
threshold for the previous sprite ELF signature onset, it is still far
in excess of that observed for nighttime sprites. The sprite event
added ![]() 1200 C
1200 C![]() km to the total charge moment change.
km to the total charge moment change.
At 23:29:03.129 UT, the third consecutive +CG to strike within the
same general region as the previous sprite-producing discharges
produced the third (and final) sprite field change.
Figure 4.5 shows that the charge moment change of
the parent discharge for the onset of this sprite field change was
3900 C![]() km after 12.3 ms had elapsed. The sprite event added
km after 12.3 ms had elapsed. The sprite event added
![]() 910 C
910 C![]() km to the total charge moment change.
km to the total charge moment change.
There were other +CGs during the 35 min data acquisition period which
also produced large slow tails but were not accompanied by isolated
slow field changes. The two such discharges with the largest charge
moment changes occurred at 23:10:40.964 UT and at 23:29:03.532 UT, and
their charge moment changes are shown in Figure 4.5.
The larger of these +CGs produced a charge moment change of
2200 C![]() km in 20 ms, which was either insufficient to initiate a
sprite or, more specifically, a sprite with a detectable ELF
signature.
km in 20 ms, which was either insufficient to initiate a
sprite or, more specifically, a sprite with a detectable ELF
signature.