Figure 5.11 shows the development of an angel sprite
cluster at 04:45:48 UT. The sprite event was associated with an
unusually energetic 165 kA +CG at 891 km range. The vertical bar in
the figure shows the altitude in kilometers above the +CG. The error
in height of the sprites would be ![]() 6 km for a 40 km radial
displacement from the +CG location.
6 km for a 40 km radial
displacement from the +CG location.
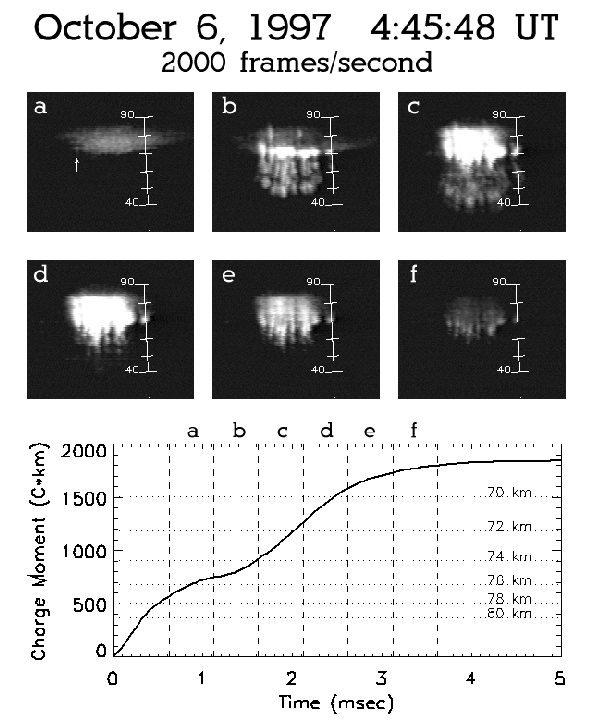 |
Figure 5.11 shows that the charge moment change of the
parent discharge rose very rapidly. Within the initial millisecond,
the charge moment exceeded the conventional breakdown threshold
between the base of the ionosphere (![]() 81 km MSL) and
81 km MSL) and
![]() 75 km MSL altitude. This should have resulted in a
diffuse luminous region due to large-scale ionization (referred to as
a ``sprite halo'' in Barrington-Leigh et al. (2000)), as was indeed
observed in frame
75 km MSL altitude. This should have resulted in a
diffuse luminous region due to large-scale ionization (referred to as
a ``sprite halo'' in Barrington-Leigh et al. (2000)), as was indeed
observed in frame ![]() . The shape and altitude extent of the sprite
halo is consistent with the theoretical predictions of
Pasko et al. (1997b).
. The shape and altitude extent of the sprite
halo is consistent with the theoretical predictions of
Pasko et al. (1997b).
The dashed vertical lines in Figure 5.11 correspond to the
light-integration periods of the second horizontal sensor block from
the top of the high-speed imaging sensor (see
Appendix A.1). This block was chosen because all but
the lowest portion of the sprite halo was within this block. There
was an apparent delay between the first appearance of the sprite halo,
which occurred in frame ![]() , and the onset of conventional breakdown
at 80 km according to the calculated charge moment change. The
apparent delay was due to the additional path length required for the
electric field from the parent discharge to propagate upwards to
produce the sprite halo before luminosity could propagate outwards to
the observer along a similar path length taken by the sferic. This
additional propagation path would result in emissions which were
delayed by approximately the propagation speed of light up to 80 km
altitude. This delay was 80/300
, and the onset of conventional breakdown
at 80 km according to the calculated charge moment change. The
apparent delay was due to the additional path length required for the
electric field from the parent discharge to propagate upwards to
produce the sprite halo before luminosity could propagate outwards to
the observer along a similar path length taken by the sferic. This
additional propagation path would result in emissions which were
delayed by approximately the propagation speed of light up to 80 km
altitude. This delay was 80/300![]() 0.27 ms, which would result in
conventional breakdown first appearing in frame a, as is observed.
0.27 ms, which would result in
conventional breakdown first appearing in frame a, as is observed.
The sprite halo reached a lower altitude of ![]() 71 km MSL in
frame
71 km MSL in
frame ![]() . However, by the end of frame
. However, by the end of frame ![]() , the charge moment change
had only exceeded the threshold at 76 km MSL altitude
(
, the charge moment change
had only exceeded the threshold at 76 km MSL altitude
(![]() 700 C
700 C![]() km) according to the calculations based on an
ionosphere conductive ledge at 81 km MSL and the geometric
considerations discussed above. The source of this discrepancy is
partly due to the choice of the ledge altitude. The breakdown will
greatly enhance the ambient conductivity and this will drop the
altitude of the ledge. Conceptually, the electric field will be
enhanced at a given altitude and charge moment change if the
conducting ledge is lowered, since the distance to the images above
the ionosphere will decrease. This will reduce the breakdown
threshold at any given altitude. This demonstrates the importance of
self-consistently modeling breakdown and relaxation-time parameters,
as was shown by Pasko et al. (1997b).
km) according to the calculations based on an
ionosphere conductive ledge at 81 km MSL and the geometric
considerations discussed above. The source of this discrepancy is
partly due to the choice of the ledge altitude. The breakdown will
greatly enhance the ambient conductivity and this will drop the
altitude of the ledge. Conceptually, the electric field will be
enhanced at a given altitude and charge moment change if the
conducting ledge is lowered, since the distance to the images above
the ionosphere will decrease. This will reduce the breakdown
threshold at any given altitude. This demonstrates the importance of
self-consistently modeling breakdown and relaxation-time parameters,
as was shown by Pasko et al. (1997b).
Dropping the ledge from 81 km MSL altitude to just above 74 km MSL
will reduce the altitude of breakdown shown in the charge moment curve
for frame ![]() from
from ![]() 76 km MSL to
76 km MSL to ![]() 74 km MSL. If the
center of the sprite halo was located at a range of
74 km MSL. If the
center of the sprite halo was located at a range of ![]() 20 km
beyond the +CG, then a feature at 74 km MSL altitude would have
appeared to have been at 71 km MSL. However, the lower extent may
also have been associated with local regions of enhanced breakdown
which developed into streamers, as discussed next.
20 km
beyond the +CG, then a feature at 74 km MSL altitude would have
appeared to have been at 71 km MSL. However, the lower extent may
also have been associated with local regions of enhanced breakdown
which developed into streamers, as discussed next.
An enhanced luminous region which extended below the base of the
sprite halo is shown by an arrow in frame ![]() . A positive streamer
developed (and split) downwards in frame
. A positive streamer
developed (and split) downwards in frame ![]() from the enhanced
luminous region at an average velocity of
from the enhanced
luminous region at an average velocity of
![]() m/s
(
m/s
(![]() 10% the velocity of light). The velocity of the positive
streamers in the angel sprites were much faster than in carrot and
columniform sprites (see Sections 5.2.3 and
5.2.4). The higher velocities are roughly consistent with
the larger charge moment change and the theoretical model of tendril
velocities put forth by Raizer et al. (1998). Several of the other
angel sprites in frame
10% the velocity of light). The velocity of the positive
streamers in the angel sprites were much faster than in carrot and
columniform sprites (see Sections 5.2.3 and
5.2.4). The higher velocities are roughly consistent with
the larger charge moment change and the theoretical model of tendril
velocities put forth by Raizer et al. (1998). Several of the other
angel sprites in frame ![]() were also preceeded by enhanced luminosity
at the base of the sprite halo in frame
were also preceeded by enhanced luminosity
at the base of the sprite halo in frame ![]() and this is consistent
with the development of angel sprites shown in
Section 5.2.5.
and this is consistent
with the development of angel sprites shown in
Section 5.2.5.
A few of the tendrils of the angel sprites reached a lower terminal
altitude of ![]() 36 km MSL in frame
36 km MSL in frame ![]() . Pasko et al. (2000)
predicted that the tendrils would terminate at
. Pasko et al. (2000)
predicted that the tendrils would terminate at ![]() 38 km under
the influence of a 1000 C
38 km under
the influence of a 1000 C![]() km parent discharge, which is roughly
consistent with the cumulative charge moment change in frame
km parent discharge, which is roughly
consistent with the cumulative charge moment change in frame ![]() .
.
A second hump in the charge moment began in the latter part of
frame ![]() and was likely correlated with current in the sprite, as
discussed in Chapter 4. The magnitude of the sprite charge
moment change is difficult to separate from the parent discharge
charge moment since the latter may still have been varying. An
extrapolation of the parent discharge slope at 1.2 ms reveals that the
sprite charge moment may have been as large as 840 C
and was likely correlated with current in the sprite, as
discussed in Chapter 4. The magnitude of the sprite charge
moment change is difficult to separate from the parent discharge
charge moment since the latter may still have been varying. An
extrapolation of the parent discharge slope at 1.2 ms reveals that the
sprite charge moment may have been as large as 840 C![]() km, which
would be the largest charge moment change ever indicated for a
nighttime sprite. As was shown in Section 4.3, daytime
sprites can produce significantly larger charge moment changes than
even this extreme event.
km, which
would be the largest charge moment change ever indicated for a
nighttime sprite. As was shown in Section 4.3, daytime
sprites can produce significantly larger charge moment changes than
even this extreme event.