Figure 5.10 shows a high-speed video sequence obtained at 2000 frames/second of a cluster of carrot and columniform sprites. The grey-scale was stretched somewhat so that fainter features would be more visible. The charge moment change of the parent +CG discharge was determined from magnetic-field ELF measurements by a technique identical to that used in Chapter 4 (see Section 4.1). The NLDN detected the +CG, but could not give an accurate estimate of its location or peak-current magnitude.
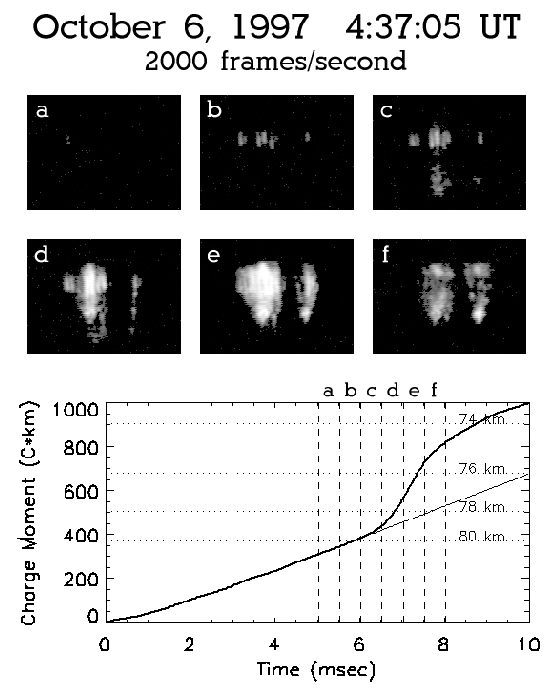 |
The approximate light integration periods of frames ![]() -
-![]() are
bounded by vertical dashed lines in the charge moment plot of
Figure 5.10. As discussed in
Appendix A.1, the high-speed video frame is integrated
in horizontal blocks. The light integration periods correspond to
that of the 3rd block down from the top, since this is the block in
which the sprites first appeared in frames
are
bounded by vertical dashed lines in the charge moment plot of
Figure 5.10. As discussed in
Appendix A.1, the high-speed video frame is integrated
in horizontal blocks. The light integration periods correspond to
that of the 3rd block down from the top, since this is the block in
which the sprites first appeared in frames ![]() and
and ![]() .
.
A single sprite column is visible in frame ![]() , just over 5 ms after
the onset of the +CG. The +CG's cumulative charge moment change was
310-350 C
, just over 5 ms after
the onset of the +CG. The +CG's cumulative charge moment change was
310-350 C![]() km during frame a. Additional sprite columns appeared
in frame
km during frame a. Additional sprite columns appeared
in frame ![]() . It was shown in Section 5.2.3 that the onset
of sprites can be at the limit of detectability at
. It was shown in Section 5.2.3 that the onset
of sprites can be at the limit of detectability at ![]() 300 km
range. It follows that sprite onset may have been undetected at the
300 km
range. It follows that sprite onset may have been undetected at the
![]() 900 km range to this sprite cluster. As
Figure 5.2 demonstrated, sprites usually brightened
dramatically in the initial frames, so the initiation of these sprites
probably occurred not much more than one frame earlier than the first
detected luminosity. Thus, the charge moment threshold for sprite
initiation was
900 km range to this sprite cluster. As
Figure 5.2 demonstrated, sprites usually brightened
dramatically in the initial frames, so the initiation of these sprites
probably occurred not much more than one frame earlier than the first
detected luminosity. Thus, the charge moment threshold for sprite
initiation was ![]() 300 C
300 C![]() km. A similar threshold was
observed for other sprite clusters in this study.
km. A similar threshold was
observed for other sprite clusters in this study.
A 300 C![]() km sprite-initiation threshold is consistent the
200-400 C
km sprite-initiation threshold is consistent the
200-400 C![]() km estimate based on static-field measurements
presented in Chapter 5. This threshold is also consistent
with earlier ELF measurements of the minimum charge moment change
associated with sprite-producing discharges
(Cummer and Inan, 1997; Huang et al., 1999). Based on an assumption of a
breakdown threshold of 100 Td, Fernsler and Rowland (1996) predicted that
300 C
km estimate based on static-field measurements
presented in Chapter 5. This threshold is also consistent
with earlier ELF measurements of the minimum charge moment change
associated with sprite-producing discharges
(Cummer and Inan, 1997; Huang et al., 1999). Based on an assumption of a
breakdown threshold of 100 Td, Fernsler and Rowland (1996) predicted that
300 C![]() km would be sufficient to initiate conventional breakdown
at 80 km altitude. The threshold at 80 km calculated in this work
(see Figure 2.9) is somewhat larger than
300 C
km would be sufficient to initiate conventional breakdown
at 80 km altitude. The threshold at 80 km calculated in this work
(see Figure 2.9) is somewhat larger than
300 C![]() km since a value of 123 Td was used for the breakdown
threshold, as discussed in Section 2.2.3.
km since a value of 123 Td was used for the breakdown
threshold, as discussed in Section 2.2.3.
In Section 5.2.4, it was shown that sprites typically
initiated at 76-79 km MSL altitude. Based on a uniformly charged disc
model presented in Section 2.5.2 with ![]() km and
km and
![]() km MSL, corresponding to measurements presented in
Chapter 3, the charge moment threshold for conventional
breakdown is
km MSL, corresponding to measurements presented in
Chapter 3, the charge moment threshold for conventional
breakdown is ![]() 430 C
430 C![]() km at 79 km MSL and
km at 79 km MSL and
![]() 680 C
680 C![]() km at 76 km MSL. Thus, the measured charge
moments for sprite initiation were 1.4-2.3 times less than required
to initiate conventional breakdown in a homogeneously stratified
atmosphere. Significant spatial variation in conductivity might
enhance the electric field in localized regions to the point of
breakdown. Such conductivity inhomogeneities might be produced by
radiated fields from the lightning discharge (Valdivia et al., 1998).
km at 76 km MSL. Thus, the measured charge
moments for sprite initiation were 1.4-2.3 times less than required
to initiate conventional breakdown in a homogeneously stratified
atmosphere. Significant spatial variation in conductivity might
enhance the electric field in localized regions to the point of
breakdown. Such conductivity inhomogeneities might be produced by
radiated fields from the lightning discharge (Valdivia et al., 1998).