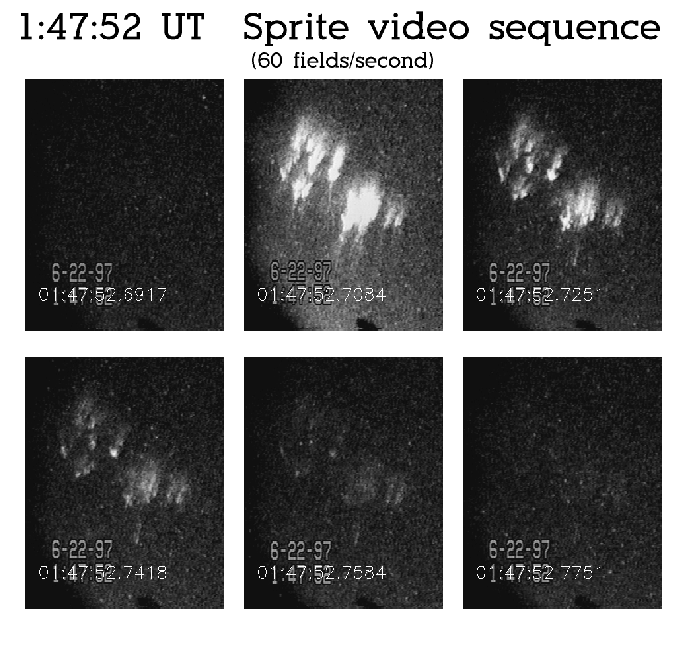
The second sprite event of the June 22nd storm was associated with a 83.7 kA +CG at 01:47:52.7112 UT. The video sequence of the sprite cluster is shown in Figure 3.8. The sprite reached maximum brightness in its first frame and then faded into the next 3 frames until it was at the limit of detectability.
A large number of IC and CG flashes occurred in the intervening time between the first and second sprite-producing flashes. However, none of these flashes developed very far into the stratiform region.
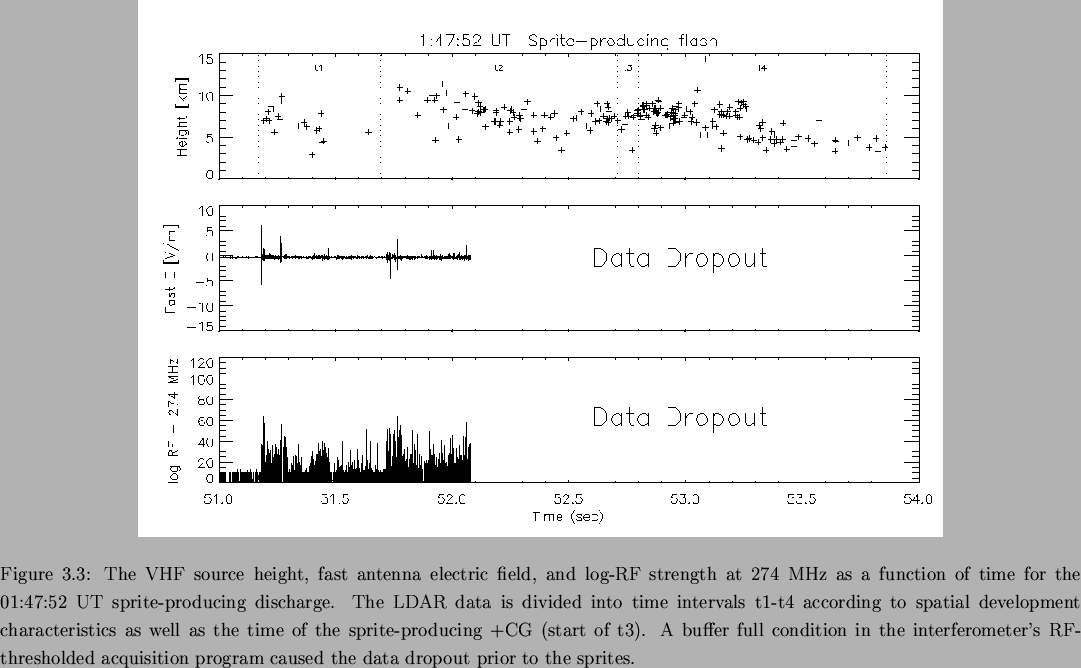
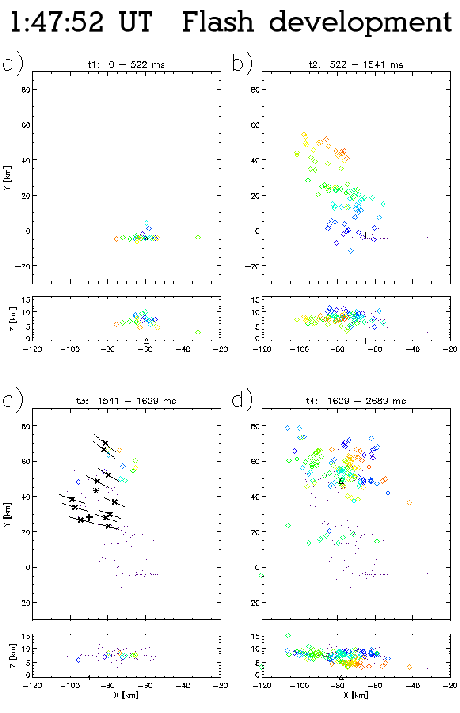
The 01:47:52 UT flash began as an ordinary -CG discharge. A -31.2 kA -CG occurred at 01:47:51.4763 UT, about 0.3 s after the start of the flash, according to Figure 3.9. Only a single data point was located by LDAR in the subsequent 0.3 s, though the interferometer log-RF record indicates that there was activity throughout this interval. Figure 3.10a shows that the VHF sources within interval t1 were relatively localized.
The flash developed horizontally outward into the stratiform region
during interval t2 (Figure 3.10b). The
lateral extent grew to ![]() 64 km in
64 km in ![]() 1 s during interval t2,
corresponding to a progression velocity of 6.4
1 s during interval t2,
corresponding to a progression velocity of 6.4![]() 10
10![]() m/s.
This is somewhat less than typically observed for negative leaders,
but is not unrealistically low.
m/s.
This is somewhat less than typically observed for negative leaders,
but is not unrealistically low.
The NLDN indicated that a 9.7 kA +CG occurred at 01:47:52.3209 UT
about 5 km west of the earlier -CG. The ``weak'' current (relative
to ordinary +CGs) indicates that this was probably an IC event, as
discussed earlier in Section 3.4. Unfortunately, the
interferometer buffer filled up due to an excessive number of
RF-triggers during the flash. This resulted in the loss of all fast
antenna, log-RF, and phase data for the remaining flash activity,
starting at ![]() 0.24 s prior to the weak +CG. The slow antenna
data, which is stored in a separate buffer, was also affected by the
lock-up and was lost for the entire flash.
0.24 s prior to the weak +CG. The slow antenna
data, which is stored in a separate buffer, was also affected by the
lock-up and was lost for the entire flash.
 |
 |
A 83.7 kA +CG occurred at the start of interval t3 and was concurrent
with the appearance of sprites on video
(Figure 3.8). The sprite positions were
determined in the same way as before; the maximum sprite altitude was
assumed to be 87![]() 6 km. Figure 3.10c
indicates that many of the sprites occurred near the periphery of the
discharge, as in Figure 3.5d.
6 km. Figure 3.10c
indicates that many of the sprites occurred near the periphery of the
discharge, as in Figure 3.5d.
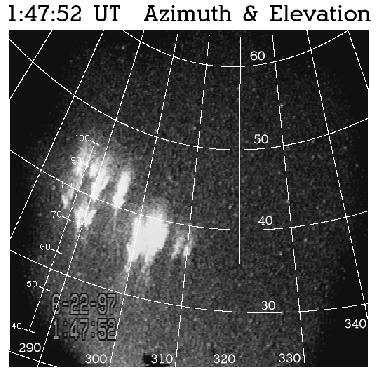
However, two of the sprites occurred to the north of the apparent northern periphery of the discharge. The discharge appeared to extend further northward during interval t3 only after the sprites appeared. Figure 3.11 shows that these sprites were tilted somewhat from vertical. The direction of the tilt (away from the center of the overall activity) is qualitatively consistent with what would be expected due to a somewhat nonvertical electric field below the ionosphere at a significant distance from the parent CG charge center. Sprites at significant tilt angles have been observed previously by Winckler et al. (1996).
 |
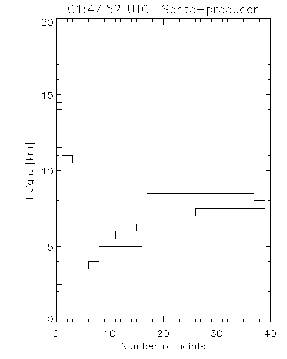
During the final time interval, numerous VHF sources were observed to
descend to 4-5 km and to propagate at that altitude. As was noted for
the previous flash, these sources were likely associated with negative
leaders (spider lightning) propagating through the positive charge
layer near the 0![]() C isotherm. These sources produced a
significant secondary maximum below 5 km in the height distribution of
VHF sources (Figure 3.12). The primary maximum
in the VHF source distribution just below 8 km altitude should
correspond to the average height of charge removal for this
sprite-producing discharge. The total duration of the flash was about
2.7 s, nearly twice that of the previous sprite-producing discharge.
C isotherm. These sources produced a
significant secondary maximum below 5 km in the height distribution of
VHF sources (Figure 3.12). The primary maximum
in the VHF source distribution just below 8 km altitude should
correspond to the average height of charge removal for this
sprite-producing discharge. The total duration of the flash was about
2.7 s, nearly twice that of the previous sprite-producing discharge.
 |
An interesting feature of time interval t4 is that the NLDN detected a -CG stroke emanating from underneath the horizontally expansive discharge. The -CG may have been produced by a negative leader spawned from the parent discharge. However, another possible origin will be discussed in Section 3.8, in which several -CG strokes were observed beneath another sprite-producing discharge.